
Page 258 - Global Project Management Handbook
P. 258
LESSONS LEARNED: REBUILDING IRAQ IN 2004 12-19
Reporting Cycle and Meetings
Reporting systems were developed on the fly in the summer of 2004. We quickly put
together the following three-level reporting/meeting system:
● Level 1 reporting called directors’ update briefs (DUBs) was the highest-level
briefing and was held every two weeks and lasted 60 to 90 minutes. The audience
for these briefs included the head of PCO, the general in charge of the Army
Corp of Engineers, and the ambassador in charge of the rebuilding effort. Each
sector was given 10 minutes to provide and overview of their efforts. Standard
slides included
● Top news stories for the week
● Summary of funding status, that is, funds apportioned, committed, obligated, and
disbursed
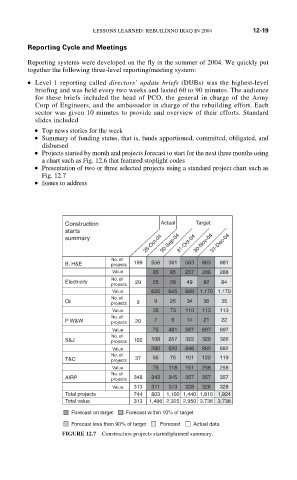
● Projects started by month and projects forecast to start for the next three months using
a chart such as Fig. 12.6 that featured stoplight codes
● Presentation of two or three selected projects using a standard project chart such as
Fig. 12.7
● Issues to address
Construction Actual Target
starts
25-Oct-04 30-Sep-04 31-Oct-04 30-Nov-04 31-Dec-04
summary
No. of
B, H&E projects 199 256 361 563 863 981
Value 85 95 257 288 288
No. of
Electricity 29 25 28 49 82 84
projects
Value 625 645 689 1,170 1,170
No. of
Oil projects 9 9 25 34 36 35
Value 35 73 110 113 113
No. of
P W&W projects 20 7 9 14 21 22
Value 75 461 567 697 697
No. of
S&J projects 102 108 257 322 329 326
Value 280 620 848 882 882
No. of
T&C projects 37 55 75 101 122 119
Value 75 118 151 258 258
No. of
AIRP projects 348 343 345 357 357 357
Value 313 311 313 328 328 328
Total projects 744 803 1,100 1,440 1,810 1,924
Total value 313 1,486 2,325 2,950 3,736 3,736
Forecast on target Forecast within 10% of target
Forecast less then 90% of target Forecast Actual data
FIGURE 12.7 Construction projects started/planned summary.