
Page 73 - Global Project Management Handbook
P. 73
3-8 STATE OF THE ART OF GLOBAL PROJECT MANAGEMENT
many coword-analysis studies (e.g., Turner et al., 1988; Courtial and Law, 1989;
Turner and Rojouan, 1991; Callon et al., 1991; Coulter et al., 1998). and the analysis
based on it is similar among these studies. All the characteristics of a strategic dia-
gram can be summarized in Fig. 3.2.
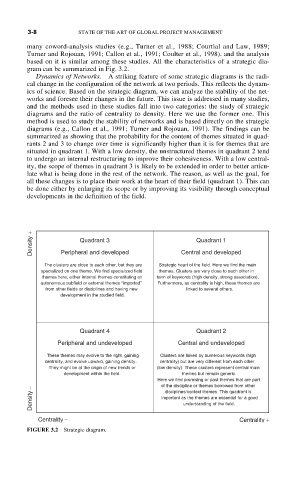
Dynamics of Networks. A striking feature of some strategic diagrams is the radi-
cal change in the configuration of the network at two periods. This reflects the dynam-
ics of science. Based on the strategic diagram, we can analyze the stability of the net-
works and foresee their changes in the future. This issue is addressed in many studies,
and the methods used in these studies fall into two categories: the study of strategic
diagrams and the ratio of centrality to density. Here we use the former one. This
method is used to study the stability of networks and is based directly on the strategic
diagrams (e.g., Callon et al., 1991; Turner and Rojouan, 1991). The findings can be
summarized as showing that the probability for the content of themes situated in quad-
rants 2 and 3 to change over time is significantly higher than it is for themes that are
situated in quadrant 1. With a low density, the unstructured themes in quadrant 2 tend
to undergo an internal restructuring to improve their cohesiveness. With a low central-
ity, the scope of themes in quadrant 3 is likely to be extended in order to better articu-
late what is being done in the rest of the network. The reason, as well as the goal, for
all these changes is to place their work at the heart of their field (quadrant 1). This can
be done either by enlarging its scope or by improving its visibility through conceptual
developments in the definition of the field.
Density + Peripheral and developed Central and developed
Quadrant 3
Quadrant 1
The clusters are close to each other, but they are Strategic heart of the field. Here we find the main
specialized on one theme. We find specialized field themes. Clusters are very close to each other in
themes here, either internal themes constituting an term of keywords (high density, strong association).
autonomous subfield or external themes “imported” Furthermore, as centrality is high, these themes are
from other fields or disciplines and having new linked to several others.
development in the studied field.
Quadrant 4 Quadrant 2
Peripheral and undeveloped Central and undeveloped
These themes may evolve to the right, gaining Clusters are linked by numerous keywords (high
centrality, and evolve upward, gaining density. centrality) but are very different from each other
They might be at the origin of new trends or (low density). These clusters represent central main
development within the field. themes but remain generic.
Here we find promising or past themes that are part
of the discipline or themes borrowed from other
Density − important as the themes are essential for a good
disciplines/context themes. This quadrant is
understanding of the field.
Centrality − Centrality +
FIGURE 3.2 Strategic diagram.