
Page 76 - Global Project Management Handbook
P. 76
THE FUTURE OF PROJECT MANAGEMENT 3-11
define the descriptors (index) and constitute the dictionary we are using for this research,
and (3) the choice of the parameters for the analysis (use of SAMPLER, developed by
Cisi, Groupe Compagnie des Signaux).
Resulting Data: Overview and First Findings
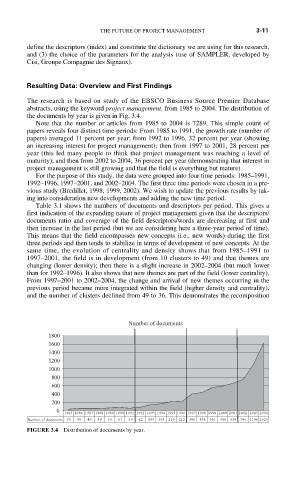
The research is based on study of the EBSCO Business Source Premier Database
abstracts, using the keyword project management, from 1985 to 2004. The distribution of
the documents by year is given in Fig. 3.4.
Note that the number or articles from 1985 to 2004 is 7289. This simple count of
papers reveals four distinct time periods: From 1985 to 1991, the growth rate (number of
papers) averaged 11 percent per year; from 1992 to 1996, 32 percent per year (showing
an increasing interest for project management); then from 1997 to 2001, 28 percent per
year (this led many people to think that project management was reaching a level of
maturity); and then from 2002 to 2004, 36 percent per year (demonstrating that interest in
project management is still growing and that the field is everything but mature).
For the purpose of this study, the data were grouped into four time periods: 1985–1991,
1992–1996, 1997–2001, and 2002–2004. The first three time periods were chosen in a pre-
vious study (Bredillet, 1998, 1999, 2002). We wish to update the previous results by tak-
ing into consideration new developments and adding the new time period.
Table 3.1 shows the numbers of documents and descriptors per period. This gives a
first indication of the expanding nature of project management given that the descriptors/
documents ratio and coverage of the field descriptors/words are decreasing at first and
then increase in the last period (but we are considering here a three-year period of time).
This means that the field encompasses new concepts (i.e., new words) during the first
three periods and then tends to stabilize in terms of development of new concepts. At the
same time, the evolution of centrality and density shows that from 1985–1991 to
1997–2001, the field is in development (from 10 clusters to 49) and that themes are
changing (lower density); then there is a slight increase in 2002–2004 (but much lower
than for 1992–1996). It also shows that new themes are part of the field (lower centrality).
From 1997–2001 to 2002–2004, the change and arrival of new themes occurring in the
previous period became more integrated within the field (higher density and centrality),
and the number of clusters declined from 49 to 36. This demonstrates the recomposition
Number of documents
1800
1600
1400
1200
1000
800
600
400
200
0 1985 1986 1987 1988 1989 1990 1991 1992 1993 1994 1995 1996 1997 1998 1999 2000 2001 2002 2003 2004
Number of documents 35 48 49 49 65 67 59 82 143 163 219 212 396 434 551 586 654 746 1106 1625
FIGURE 3.4 Distribution of documents by year.