
Page 80 - Global Project Management Handbook
P. 80
1997–2001 d.m = 0.058869 c.m = 0.009138 2002–2004 d.m = 0.044454 c.m = 0.004941 density centrality density centrality quadrant 1 d 0.066938 0.014941 training 0.070964 0.006664 power 0.069814 0.011054 financial 0.073994 0.006510 computer c 0.063660 0.011329 director 0.061675 0.018087 budget 0.13666
d.m = 0.076533 density 0.131418 0.250531 0.106422 0.123505 0.389269 0.058539 0.074337 0.057516 0.066979 0.063441 0.075002 0.010823 0.086731 0.061161 0.020134 0.069255 0.041735 0.040481 0.034787 0.072493 0.017723 0.026506 0.037190 0.064798 0.030642 0.016946 0.038027
c.m = 0.020814 centrality 0.034097 0.029669 0.025494 0.030698 0.048416 0.023011 0.021773 0.022693 0.033787 0.032323 0.021666 0.021677 0.016213 0.014133 0.012724 0.019191 0.013911 0.016839 0.016105 0.006593 0.015408 0.011961 0.014835 0.019168 0.012763 0.006799 0.020026
1992–1996 cost information engineering development system production market level schedule quality strategic target method department function training managing field review accounting ability complete percent client contractor division group
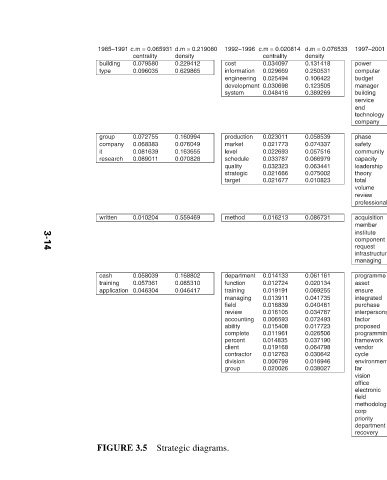
d.m = 0.219080 density 0.229412 0.629865 0.160994 0.076049 0.163655 0.070828 0.559469 0.168802 0.085310 0.046417 Strategic diagrams.
1985–1991 c.m = 0.065931 centrality 0.079580 building 0.096035 type 0.072755 group 0.068383 company 0.081639 it 0.089011 research 0.010204 written 0.058039 cash 0.057361 training 0.046304 application FIGURE 3.5
3-14