
Page 81 - Global Project Management Handbook
P. 81
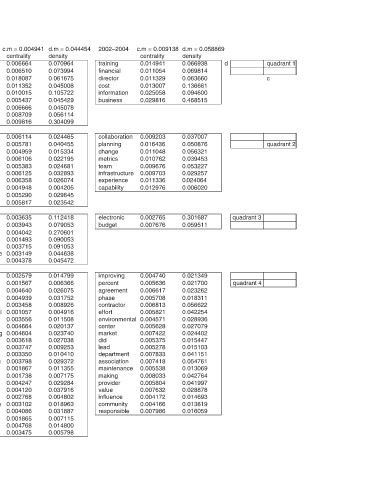
quadrant 1  c  quadrant 2

                                     quadrant 3  quadrant 4

            d
         d.m = 0.058869  density  0.066938  0.069814  0.063660  0.136661  0.094600  0.468515  0.037007  0.050876  0.056321  0.039453  0.053227  0.029257  0.024064  0.006020  0.301687  0.059511  0.021349  0.021700  0.023262  0.018311  0.056622  0.042254  0.028936  0.027079  0.024402  0.015447  0.015103  0.041151  0.


         c.m = 0.009138  centrality  0.014941  0.011054  0.011329  0.013007  0.025058  0.029816  0.009203  0.016436  0.011048  0.010762  0.009676  0.009703  0.011336  0.012976  0.002765  0.007676  0.004740  0.005636  0.006617  0.005708  0.006813  0.005821  0.004571  0.005628  0.007422  0.005375  0.005278  0.007833


         2002–2004  training  financial  director  cost  information  business  collaboration  planning  change  metrics  team  infrastructure  experience  capability  electronic  budget  improving  percent  agreement  phase  contractor  effort  environmental  center  market  did  lead  department  association  mai


         d.m = 0.044454  density  0.070964  0.073994  0.061675  0.045008  0.105722  0.045429  0.045078  0.056114  0.304099  0.024465  0.040455  0.015334  0.022195  0.024681  0.032893  0.026074  0.004205  0.029645  0.023542  0.112418  0.079053  0.270601  0.090053  0.091053  0.044638  0.045472  0.014799  0.006366  0.


         c.m = 0.004941  centrality  0.006664  0.006510  0.018087  0.011352  0.010015  0.005437  0.006666  0.008709  0.009816  0.006114  0.005781  0.004959  0.006106  0.005383  0.006125  0.006358  0.004948  0.005290  0.005817  0.003635  0.003943  0.004042  0.001493  0.003715  0.003149  0.004378  0.002579  0.001567


         1997–2001  power  computer  budget  manager  building  service  end  technology  company  phase  safety  community  capacity  leadership  theory  total  volume  review  professional  acquisition  member  institute  component  request  infrastructure  managing  programme  asset  ensure  integrated  purchase


         d.m = 0.076533  density  0.131418  0.250531  0.106422  0.123505  0.389269  0.058539  0.074337  0.057516  0.066979  0.063441  0.075002  0.010823  0.086731  0.061161  0.020134  0.069255  0.041735  0.040481  0.034787  0.072493  0.017723  0.026506  0.037190  0.064798  0.030642     0.016946  0.038027


         c.m = 0.020814  centrality  0.034097  0.029669  0.025494  0.030698  0.048416  0.023011  0.021773  0.022693  0.033787  0.032323  0.021666  0.021677  0.016213  0.014133  0.012724  0.019191  0.013911  0.016839  0.016105  0.006593  0.015408  0.011961  0.014835  0.019168  0.012763  0.006799  0.020026


         1992–1996  cost  information  engineering  development  system  production  market  level  schedule  quality  strategic  target  method  department  function  training  managing  field  review  accounting  ability  complete  percent  client  contractor  division  group


         d.m = 0.219080  density  0.229412  0.629865  0.160994  0.076049  0.163655  0.070828  0.559469  0.168802  0.085310  0.046417  Strategic diagrams.


         1985–1991 c.m = 0.065931  centrality  0.079580  building  0.096035  type  0.072755  group  0.068383 company  0.081639  it  0.089011 research  0.010204  written  0.058039  cash  0.057361 training  0.046304 application  FIGURE 3.5


                                       3-14