
Page 109 - Global Tectonics
P. 109
96 CHAPTER 5
EU
NA
JF
AR
NB IN
PH
PA
SM
SA
NZ AU
SC
AN
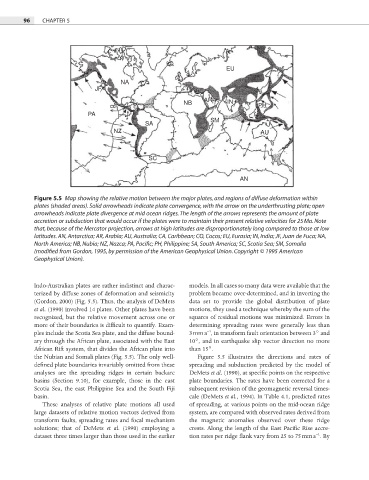
Figure 5.5 Map showing the relative motion between the major plates, and regions of diffuse deformation within
plates (shaded areas). Solid arrowheads indicate plate convergence, with the arrow on the underthrusting plate; open
arrowheads indicate plate divergence at mid ocean ridges. The length of the arrows represents the amount of plate
accretion or subduction that would occur if the plates were to maintain their present relative velocities for 25 Ma. Note
that, because of the Mercator projection, arrows at high latitudes are disproportionately long compared to those at low
latitudes. AN, Antarctica; AR, Arabia; AU, Australia; CA, Caribbean; CO, Cocos; EU, Eurasia; IN, India; JF, Juan de Fuca; NA,
North America; NB, Nubia; NZ, Nazca; PA, Pacific; PH, Philippine; SA, South America; SC, Scotia Sea; SM, Somalia
(modified from Gordon, 1995, by permission of the American Geophysical Union. Copyright © 1995 American
Geophysical Union).
Indo-Australian plates are rather indistinct and charac- models. In all cases so many data were available that the
terized by diffuse zones of deformation and seismicity problem became over-determined, and in inverting the
(Gordon, 2000) (Fig. 5.5). Thus, the analysis of DeMets data set to provide the global distribution of plate
et al. (1990) involved 14 plates. Other plates have been motions, they used a technique whereby the sum of the
recognized, but the relative movement across one or squares of residual motions was minimized. Errors in
more of their boundaries is difficult to quantify. Exam- determining spreading rates were generally less than
−1
ples include the Scotia Sea plate, and the diffuse bound- 3 mm a , in transform fault orientation between 3° and
ary through the African plate, associated with the East 10°, and in earthquake slip vector direction no more
African Rift system, that divides the African plate into than 15°.
the Nubian and Somali plates (Fig. 5.5). The only well- Figure 5.5 illustrates the directions and rates of
defined plate boundaries invariably omitted from these spreading and subduction predicted by the model of
analyses are the spreading ridges in certain backarc DeMets et al. (1990), at specific points on the respective
basins (Section 9.10), for example, those in the east plate boundaries. The rates have been corrected for a
Scotia Sea, the east Philippine Sea and the South Fiji subsequent revision of the geomagnetic reversal times-
basin. cale (DeMets et al., 1994). In Table 4.1, predicted rates
These analyses of relative plate motions all used of spreading, at various points on the mid-ocean ridge
large datasets of relative motion vectors derived from system, are compared with observed rates derived from
transform faults, spreading rates and focal mechanism the magnetic anomalies observed over these ridge
solutions; that of DeMets et al. (1990) employing a crests. Along the length of the East Pacifi c Rise accre-
−1
dataset three times larger than those used in the earlier tion rates per ridge flank vary from 25 to 75 mm a . By