
Page 140 - Global Tectonics
P. 140
126 CHAPTER 6
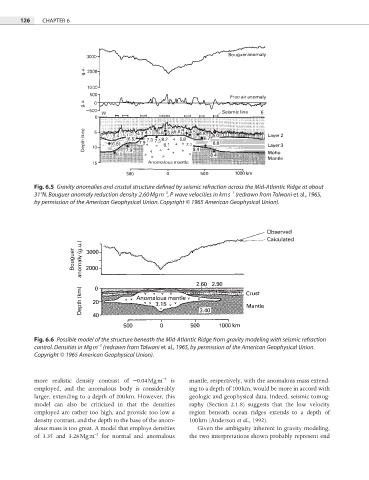
Fig. 6.5 Gravity anomalies and crustal structure defined by seismic refraction across the Mid-Atlantic Ridge at about
−1
−3
31°N. Bouguer anomaly reduction density 2.60 Mg m , P wave velocities in km s (redrawn from Talwani et al., 1965,
by permission of the American Geophysical Union. Copyright © 1965 American Geophysical Union).
Fig. 6.6 Possible model of the structure beneath the Mid-Atlantic Ridge from gravity modeling with seismic refraction
−3
control. Densities in Mg m (redrawn from Talwani et al., 1965, by permission of the American Geophysical Union.
Copyright © 1965 American Geophysical Union).
−3
more realistic density contrast of −0.04 Mg m is mantle, respectively, with the anomalous mass extend-
employed, and the anomalous body is considerably ing to a depth of 100 km, would be more in accord with
larger, extending to a depth of 200 km. However, this geologic and geophysical data. Indeed, seismic tomog-
model can also be criticized in that the densities raphy (Section 2.1.8) suggests that the low velocity
employed are rather too high, and provide too low a region beneath ocean ridges extends to a depth of
density contrast, and the depth to the base of the anom- 100 km (Anderson et al., 1992).
alous mass is too great. A model that employs densities Given the ambiguity inherent in gravity modeling,
−3
of 3.35 and 3.28 Mg m for normal and anomalous the two interpretations shown probably represent end