
Page 322 - Global Tectonics
P. 322
OROGENIC BELTS 305
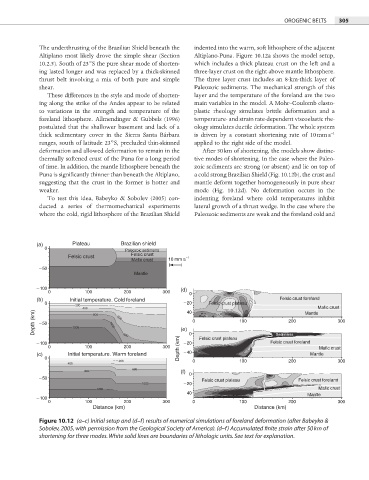
The underthrusting of the Brazilian Shield beneath the indented into the warm, soft lithosphere of the adjacent
Altiplano most likely drove the simple shear (Section Altiplano-Puna. Figure 10.12a shows the model setup,
10.2.5). South of 23°S the pure shear mode of shorten- which includes a thick plateau crust on the left and a
ing lasted longer and was replaced by a thick-skinned three-layer crust on the right above mantle lithosphere.
thrust belt involving a mix of both pure and simple The three layer crust includes an 8-km-thick layer of
shear. Paleozoic sediments. The mechanical strength of this
These differences in the style and mode of shorten- layer and the temperature of the foreland are the two
ing along the strike of the Andes appear to be related main variables in the model. A Mohr–Coulomb elasto-
to variations in the strength and temperature of the plastic rheology simulates brittle deformation and a
foreland lithosphere. Allmendinger & Gubbels (1996) temperature- and strain rate-dependent viscoelastic rhe-
postulated that the shallower basement and lack of a ology simulates ductile deformation. The whole system
−1
thick sedimentary cover in the Sierra Santa Bárbara is driven by a constant shortening rate of 10 mm a
ranges, south of latitude 23°S, precluded thin-skinned applied to the right side of the model.
deformation and allowed deformation to remain in the After 50 km of shortening, the models show distinc-
thermally softened crust of the Puna for a long period tive modes of shortening. In the case where the Paleo-
of time. In addition, the mantle lithosphere beneath the zoic sediments are strong (or absent) and lie on top of
Puna is significantly thinner than beneath the Altiplano, a cold strong Brazilian Shield (Fig. 10.12b), the crust and
suggesting that the crust in the former is hotter and mantle deform together homogeneously in pure shear
weaker. mode (Fig. 10.12d). No deformation occurs in the
To test this idea, Babeyko & Sobolev (2005) con- indenting foreland where cold temperatures inhibit
ducted a series of thermomechanical experiments lateral growth of a thrust wedge. In the case where the
where the cold, rigid lithosphere of the Brazilian Shield Paleozoic sediments are weak and the foreland cold and
(a) Plateau Brazilian shield
0
Paleozoic sediments
Felsic crust Felsic crust 1
Mafic crust 10 mm a
50
Mantle
100
0 100 200 300 (d) 0
(b) Initial temperature. Cold foreland Felsic crust foreland
0 200 20 Felsic crust plateau
400 800 40 Mantle Mafic crust
Depth (km) 50 1200 1000 600 (e) 0 100 200 300
Sediments
100 800 20 0 Felsic crust plateau Felsic crust foreland
0 100 200 300 Depth (km) Mafic crust
(c) Initial temperature. Warm foreland 40 Mantle
0 200 0 100 200 300
400
600
800 (f) 0
50 Felsic crust plateau Felsic crust foreland
1000 20
1200 Mafic crust
40 Mantle
100
0 100 200 300 0 100 200 300
Distance (km) Distance (km)
Figure 10.12 (a–c) Initial setup and (d–f) results of numerical simulations of foreland deformation (after Babeyko &
Sobolev, 2005, with permission from the Geological Society of America). (d–f) Accumulated finite strain after 50 km of
shortening for three modes. White solid lines are boundaries of lithologic units. See text for explanation.