
Page 318 - Global Tectonics
P. 318
OROGENIC BELTS 301
temperature at the Moho, which weakens failure of the foreland sediments marks a
the crust and allows its lower part to fl ow. change in the mode of shortening from pure
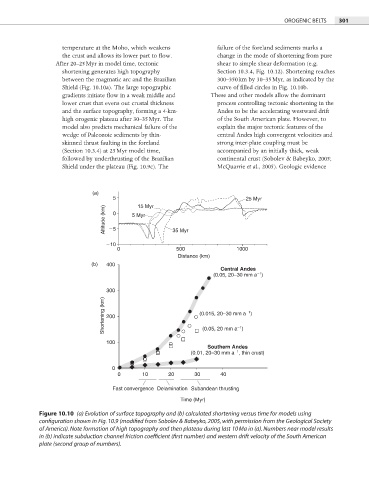
After 20–25 Myr in model time, tectonic shear to simple shear deformation (e.g.
shortening generates high topography Section 10.3.4, Fig. 10.12). Shortening reaches
between the magmatic arc and the Brazilian 300–350 km by 30–35 Myr, as indicated by the
Shield (Fig. 10.10a). The large topographic curve of filled circles in Fig. 10.10b.
gradients initiate fl ow in a weak middle and These and other models allow the dominant
lower crust that evens out crustal thickness process controlling tectonic shortening in the
and the surface topography, forming a 4-km- Andes to be the accelerating westward drift
high orogenic plateau after 30–35 Myr. The of the South American plate. However, to
model also predicts mechanical failure of the explain the major tectonic features of the
wedge of Paleozoic sediments by thin- central Andes high convergent velocities and
skinned thrust faulting in the foreland strong inter-plate coupling must be
(Section 10.3.4) at 25 Myr model time, accompanied by an initially thick, weak
followed by underthrusting of the Brazilian continental crust (Sobolev & Babeyko, 2005;
Shield under the plateau (Fig. 10.9c). The McQuarrie et al., 2005). Geologic evidence
(a)
5 15 Myr 25 Myr
Altitude (km) 5 0 5 Myr 35 Myr
10
0 500 1000
Distance (km)
(b) 400
Central Andes
1
(0.05, 20–30 mm a )
300
Shortening (km) 200 (0.015, 20–30 mm a )
1
(0.05, 20 mm a )
1
100
Southern Andes
(0.01, 20–30 mm a , thin crust)
1
0
0 10 20 30 40
Fast convergence Delamination Subandean thrusting
Time (Myr)
Figure 10.10 (a) Evolution of surface topography and (b) calculated shortening versus time for models using
configuration shown in Fig. 10.9 (modified from Sobolev & Babeyko, 2005, with permission from the Geological Society
of America). Note formation of high topography and then plateau during last 10 Ma in (a). Numbers near model results
in (b) indicate subduction channel friction coefficient (first number) and western drift velocity of the South American
plate (second group of numbers).