
Page 37 - Global Tectonics
P. 37
24 CHAPTER 2
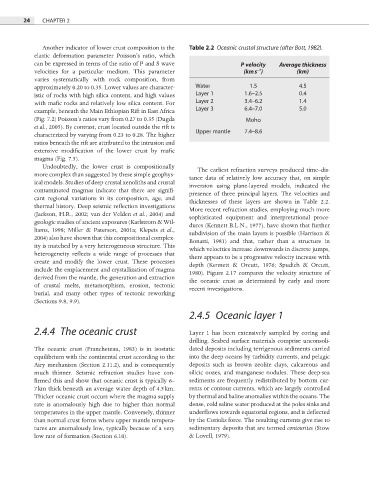
Another indicator of lower crust composition is the Table 2.2 Oceanic crustal structure (after Bott, 1982).
elastic deformation parameter Poisson’s ratio, which
can be expressed in terms of the ratio of P and S wave P velocity Average thickness
−1
velocities for a particular medium. This parameter (km s ) (km)
varies systematically with rock composition, from
approximately 0.20 to 0.35. Lower values are character- Water 1.5 4.5
istic of rocks with high silica content, and high values Layer 1 1.6–2.5 0.4
with mafic rocks and relatively low silica content. For Layer 2 3.4–6.2 1.4
example, beneath the Main Ethiopian Rift in East Africa Layer 3 6.4–7.0 5.0
(Fig. 7.2) Poisson’s ratios vary from 0.27 to 0.35 (Dugda Moho
et al., 2005). By contrast, crust located outside the rift is
Upper mantle 7.4–8.6
characterized by varying from 0.23 to 0.28. The higher
ratios beneath the rift are attributed to the intrusion and
extensive modification of the lower crust by mafi c
magma (Fig. 7.5).
Undoubtedly, the lower crust is compositionally
The earliest refraction surveys produced time–dis-
more complex than suggested by these simple geophys-
tance data of relatively low accuracy that, on simple
ical models. Studies of deep crustal xenoliths and crustal
inversion using plane-layered models, indicated the
contaminated magmas indicate that there are signifi -
presence of three principal layers. The velocities and
cant regional variations in its composition, age, and
thicknesses of these layers are shown in Table 2.2.
thermal history. Deep seismic refl ection investigations
More recent refraction studies, employing much more
(Jackson, H.R., 2002; van der Velden et al., 2004) and
sophisticated equipment and interpretational proce-
geologic studies of ancient exposures (Karlstrom & Wil-
dures (Kennett B.L.N., 1977), have shown that further
liams, 1998; Miller & Paterson, 2001a; Klepeis et al.,
subdivision of the main layers is possible (Harrison &
2004) also have shown that this compositional complex-
Bonatti, 1981) and that, rather than a structure in
ity is matched by a very heterogeneous structure. This
which velocities increase downwards in discrete jumps,
heterogeneity reflects a wide range of processes that
there appears to be a progressive velocity increase with
create and modify the lower crust. These processes
depth (Kennett & Orcutt, 1976; Spudich & Orcutt,
include the emplacement and crystallization of magma
1980). Figure 2.17 compares the velocity structure of
derived from the mantle, the generation and extraction
the oceanic crust as determined by early and more
of crustal melts, metamorphism, erosion, tectonic
recent investigations.
burial, and many other types of tectonic reworking
(Sections 9.8, 9.9).
2.4.5 Oceanic layer 1
2.4.4 The oceanic crust Layer 1 has been extensively sampled by coring and
drilling. Seabed surface materials comprise unconsoli-
The oceanic crust (Francheteau, 1983) is in isostatic dated deposits including terrigenous sediments carried
equilibrium with the continental crust according to the into the deep oceans by turbidity currents, and pelagic
Airy mechanism (Section 2.11.2), and is consequently deposits such as brown zeolite clays, calcareous and
much thinner. Seismic refraction studies have con- silicic oozes, and manganese nodules. These deep-sea
firmed this and show that oceanic crust is typically 6– sediments are frequently redistributed by bottom cur-
7 km thick beneath an average water depth of 4.5 km. rents or contour currents, which are largely controlled
Thicker oceanic crust occurs where the magma supply by thermal and haline anomalies within the oceans. The
rate is anomalously high due to higher than normal dense, cold saline water produced at the poles sinks and
temperatures in the upper mantle. Conversely, thinner underflows towards equatorial regions, and is defl ected
than normal crust forms where upper mantle tempera- by the Coriolis force. The resulting currents give rise to
tures are anomalously low, typically because of a very sedimentary deposits that are termed contourites (Stow
low rate of formation (Section 6.10). & Lovell, 1979).