
Page 401 - Global Tectonics
P. 401
THE MECHANISM OF PLATE TECTONICS 383
100 km; and second, that a more effi cient mechanism heat flow measured or predicted in 5° × 5° grid areas
than conduction operates below this depth whereby of the globe. This procedure imparts a certain smooth-
heat is transferred at a much lower thermal gradient. ing of the true pattern, so that variations with wave-
These processes can be distinguished by considering the lengths of less than about 3300 km are not represented.
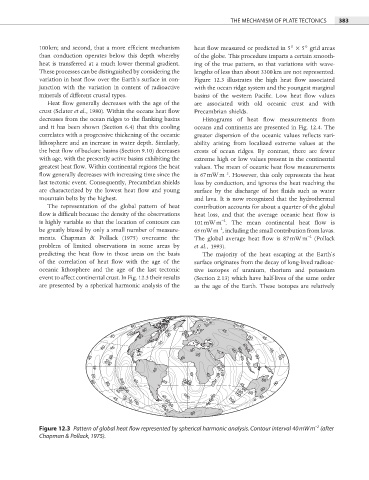
variation in heat flow over the Earth’s surface in con- Figure 12.3 illustrates the high heat fl ow associated
junction with the variation in content of radioactive with the ocean ridge system and the youngest marginal
minerals of different crustal types. basins of the western Pacific. Low heat fl ow values
Heat flow generally decreases with the age of the are associated with old oceanic crust and with
crust (Sclater et al., 1980). Within the oceans heat fl ow Precambrian shields.
decreases from the ocean ridges to the fl anking basins Histograms of heat flow measurements from
and it has been shown (Section 6.4) that this cooling oceans and continents are presented in Fig. 12.4. The
correlates with a progressive thickening of the oceanic greater dispersion of the oceanic values refl ects vari-
lithosphere and an increase in water depth. Similarly, ability arising from localized extreme values at the
the heat flow of backarc basins (Section 9.10) decreases crests of ocean ridges. By contrast, there are fewer
with age, with the presently active basins exhibiting the extreme high or low values present in the continental
greatest heat flow. Within continental regions the heat values. The mean of oceanic heat fl ow measurements
flow generally decreases with increasing time since the is 67 mW m . However, this only represents the heat
−2
last tectonic event. Consequently, Precambrian shields loss by conduction, and ignores the heat reaching the
are characterized by the lowest heat flow and young surface by the discharge of hot fluids such as water
mountain belts by the highest. and lava. It is now recognized that the hydrothermal
The representation of the global pattern of heat contribution accounts for about a quarter of the global
flow is diffi cult because the density of the observations heat loss, and that the average oceanic heat fl ow is
−2
is highly variable so that the location of contours can 101 mW m . The mean continental heat fl ow is
−2
be greatly biased by only a small number of measure- 65 mW m , including the small contribution from lavas.
ments. Chapman & Pollack (1975) overcame the The global average heat flow is 87 mW m (Pollack
−2
problem of limited observations in some areas by et al., 1993).
predicting the heat flow in those areas on the basis The majority of the heat escaping at the Earth’s
of the correlation of heat flow with the age of the surface originates from the decay of long-lived radioac-
oceanic lithosphere and the age of the last tectonic tive isotopes of uranium, thorium and potassium
event to affect continental crust. In Fig. 12.3 their results (Section 2.13) which have half-lives of the same order
are presented by a spherical harmonic analysis of the as the age of the Earth. These isotopes are relatively
60 80 45
120 60 80 45
45 60 80 45
45 45
60 45 60 45 45 80 45 60 45
45 60 45 45 45 60 80 60 45
80 45
45 45 80
45 45 60
160 120
120 80 60 45 80
60
45 45 80
80
240
80
60 60
80
45 200 120 80
80 160
45
160
45 60 60 45
60 200
120
160
60 80 45
45
60
−2
Figure 12.3 Pattern of global heat flow represented by spherical harmonic analysis. Contour interval 40 mW m (after
Chapman & Pollack, 1975).