
Page 48 - Global Tectonics
P. 48
THE INTERIOR OF THE EARTH 35
3 2
(a) 1 (b) (c)
3 1 3
2
2 1
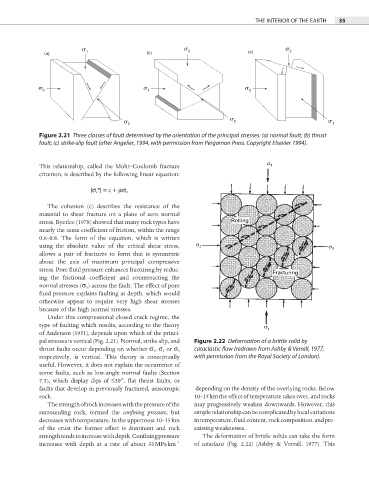
Figure 2.21 Three classes of fault determined by the orientation of the principal stresses: (a) normal fault; (b) thrust
fault; (c) strike-slip fault (after Angelier, 1994, with permission from Pergamon Press. Copyright Elsevier 1994).
This relationship, called the Mohr–Coulomb fracture
criterion, is described by the following linear equation:
|σ s *| = c + μσ n
The cohesion (c) describes the resistance of the
material to shear fracture on a plane of zero normal
stress. Byerlee (1978) showed that many rock types have
nearly the same coefficient of friction, within the range
0.6–0.8. The form of the equation, which is written
using the absolute value of the critical shear stress,
allows a pair of fractures to form that is symmetric
about the axis of maximum principal compressive
stress. Pore fluid pressure enhances fracturing by reduc-
ing the frictional coefficient and counteracting the
normal stresses (σ n ) across the fault. The effect of pore
fluid pressure explains faulting at depth, which would
otherwise appear to require very high shear stresses
because of the high normal stresses.
Under this compressional closed crack regime, the
type of faulting which results, according to the theory
of Anderson (1951), depends upon which of the princi-
pal stresses is vertical (Fig. 2.21). Normal, strike-slip, and Figure 2.22 Deformation of a brittle solid by
thrust faults occur depending on whether σ 1 , σ 2 or σ 3 cataclastic flow (redrawn from Ashby & Verrall, 1977,
respectively, is vertical. This theory is conceptually with permission from the Royal Society of London).
useful. However, it does not explain the occurrence of
some faults, such as low-angle normal faults (Section
7.3), which display dips of ≤30°, flat thrust faults, or
faults that develop in previously fractured, anisotropic depending on the density of the overlying rocks. Below
rock. 10–15 km the effect of temperature takes over, and rocks
The strength of rock increases with the pressure of the may progressively weaken downwards. However, this
surrounding rock, termed the confi ning pressure, but simple relationship can be complicated by local variations
decreases with temperature. In the uppermost 10–15 km in temperature, fluid content, rock composition, and pre-
of the crust the former effect is dominant and rock existing weaknesses.
strength tends to increase with depth. Confi ning pressure The deformation of brittle solids can take the form
increases with depth at a rate of about 33 MPa km −1 of cataclasis (Fig. 2.22) (Ashby & Verrall, 1977). This