
Page 53 - Global Tectonics
P. 53
40 CHAPTER 2
(a) log( )(MPa) (b) log( )(MPa)
1 3 1 3
1 0 1 2 3 1 0 1 2 3
0 0
Moho Crust
Mantle Crust
Moho
40 40 Mantle
Depth (km) 80 Depth (km) 80
Oceanic strength profile Continental strength profile
120 120
(c) Differential stress (MPa) (d) Differential stress (MPa)
1000 2000 3000 1000 2000 3000
0 0
Byerlee’s law Byerlee’s law
10 200 10 200
Depth (km) 20 Wet quartz middle crust 400 Temperature ( C) Depth (km) 20 Wet quartz middle crust 400 Temperature ( C)
Dry
30
30
lower crust
Moho 600 Wet lower crust Moho 600
40 40
Wet olivine upper mantle
50 50 Dry olivine upper mantle
800 800
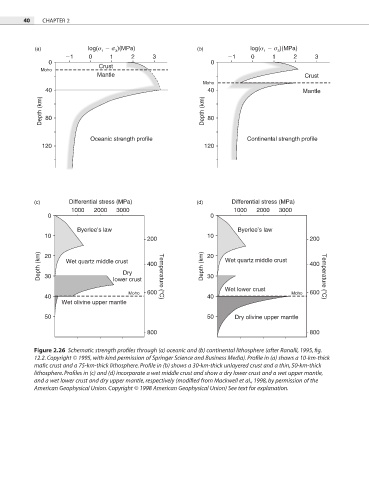
Figure 2.26 Schematic strength profiles through (a) oceanic and (b) continental lithosphere (after Ranalli, 1995, fig.
12.2. Copyright © 1995, with kind permission of Springer Science and Business Media). Profile in (a) shows a 10-km-thick
mafic crust and a 75-km-thick lithosphere. Profile in (b) shows a 30-km-thick unlayered crust and a thin, 50-km-thick
lithosphere. Profiles in (c) and (d) incorporate a wet middle crust and show a dry lower crust and a wet upper mantle,
and a wet lower crust and dry upper mantle, respectively (modified from Mackwell et al., 1998, by permission of the
American Geophysical Union. Copyright © 1998 American Geophysical Union) See text for explanation.