
Page 57 - Global Tectonics
P. 57
44 CHAPTER 2
a
ρ
T pc
ρ h = z h s
( p T + ) h
A similar computation for an ocean basin gives: Lithosphere
ρ c − z ρ w )
(T p
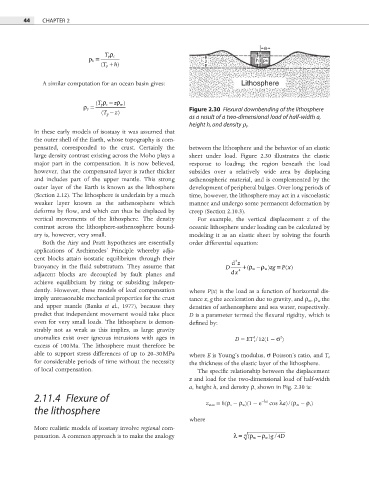
ρ z = Figure 2.30 Flexural downbending of the lithosphere
z
(T p − )
as a result of a two-dimensional load of half-width a,
height h, and density r s .
In these early models of isostasy it was assumed that
the outer shell of the Earth, whose topography is com-
pensated, corresponded to the crust. Certainly the between the lithosphere and the behavior of an elastic
large density contrast existing across the Moho plays a sheet under load. Figure 2.30 illustrates the elastic
major part in the compensation. It is now believed, response to loading; the region beneath the load
however, that the compensated layer is rather thicker subsides over a relatively wide area by displacing
and includes part of the upper mantle. This strong asthenospheric material, and is complemented by the
outer layer of the Earth is known as the lithosphere development of peripheral bulges. Over long periods of
(Section 2.12). The lithosphere is underlain by a much time, however, the lithosphere may act in a viscoelastic
weaker layer known as the asthenosphere which manner and undergo some permanent deformation by
deforms by flow, and which can thus be displaced by creep (Section 2.10.3).
vertical movements of the lithosphere. The density For example, the vertical displacement z of the
contrast across the lithosphere-asthenosphere bound- oceanic lithosphere under loading can be calculated by
ary is, however, very small. modeling it as an elastic sheet by solving the fourth
Both the Airy and Pratt hypotheses are essentially order differential equation:
applications of Archimedes’ Principle whereby adja-
cent blocks attain isostatic equilibrium through their 4
=
buoyancy in the fluid substratum. They assume that D d z 4 +(ρ m −ρ w ) zg P x ( )
adjacent blocks are decoupled by fault planes and d x
achieve equilibrium by rising or subsiding indepen-
dently. However, these models of local compensation where P(x) is the load as a function of horizontal dis-
imply unreasonable mechanical properties for the crust tance x, g the acceleration due to gravity, and ρ m , ρ w the
and upper mantle (Banks et al., 1977), because they densities of asthenosphere and sea water, respectively.
predict that independent movement would take place D is a parameter termed the flexural rigidity, which is
even for very small loads. The lithosphere is demon- defi ned by:
strably not as weak as this implies, as large gravity
anomalies exist over igneous intrusions with ages in D = ET e /12(1 − σ )
2
3
excess of 100 Ma. The lithosphere must therefore be
able to support stress differences of up to 20–30 MPa where E is Young’s modulus, σ Poisson’s ratio, and T e
for considerable periods of time without the necessity the thickness of the elastic layer of the lithosphere.
of local compensation. The specific relationship between the displacement
z and load for the two-dimensional load of half-width
a, height h, and density ρ s shown in Fig. 2.30 is:
2.11.4 Flexure of
−λa
z max = h(ρ s − ρ w )(1 − e cos λa)/(ρ m − ρ s )
the lithosphere
where
More realistic models of isostasy involve regional com-
ρ −
4
g
4
pensation. A common approach is to make the analogy λ = ( m ρ ) / D
w