
Page 61 - Global Tectonics
P. 61
48 CHAPTER 2
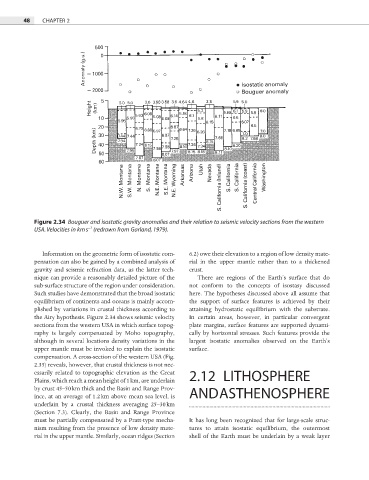
Figure 2.34 Bouguer and isostatic gravity anomalies and their relation to seismic velocity sections from the western
−1
USA. Velocities in km s (redrawn from Garland, 1979).
Information on the geometric form of isostatic com- 6.2) owe their elevation to a region of low density mate-
pensation can also be gained by a combined analysis of rial in the upper mantle rather than to a thickened
gravity and seismic refraction data, as the latter tech- crust.
nique can provide a reasonably detailed picture of the There are regions of the Earth’s surface that do
sub-surface structure of the region under consideration. not conform to the concepts of isostasy discussed
Such studies have demonstrated that the broad isostatic here. The hypotheses discussed above all assume that
equilibrium of continents and oceans is mainly accom- the support of surface features is achieved by their
plished by variations in crustal thickness according to attaining hydrostatic equilibrium with the substrate.
the Airy hypothesis. Figure 2.34 shows seismic velocity In certain areas, however, in particular convergent
sections from the western USA in which surface topog- plate margins, surface features are supported dynami-
raphy is largely compensated by Moho topography, cally by horizontal stresses. Such features provide the
although in several locations density variations in the largest isostatic anomalies observed on the Earth’s
upper mantle must be invoked to explain the isostatic surface.
compensation. A cross-section of the western USA (Fig.
2.35) reveals, however, that crustal thickness is not nec-
essarily related to topographic elevation as the Great
Plains, which reach a mean height of 1 km, are underlain 2.12 LITHOSPHERE
by crust 45–50 km thick and the Basin and Range Prov-
ince, at an average of 1.2 km above mean sea level, is AND ASTHENOSPHERE
underlain by a crustal thickness averaging 25–30 km
(Section 7.3). Clearly, the Basin and Range Province
must be partially compensated by a Pratt-type mecha- It has long been recognized that for large-scale struc-
nism resulting from the presence of low density mate- tures to attain isostatic equilibrium, the outermost
rial in the upper mantle. Similarly, ocean ridges (Section shell of the Earth must be underlain by a weak layer