
Page 58 - Global Tectonics
P. 58
THE INTERIOR OF THE EARTH 45
and ρ w , ρ m the densities of water and the mantle, surface compensation. Such loads include small topo-
respectively. graphic features and variations in crustal density due,
Note that as the elastic layer becomes more rigid, D for example, to small granitic or mafi c bodies within
approaches infi nity, λ approaches zero, and the depres- the crust. This more realistic model of isostatic com-
sion due to loading becomes small. Conversely, as the pensation, that takes into account the fl exural rigidity
layer becomes weaker, D approaches zero, λ approaches of the lithosphere, is referred to as fl exural isostasy
infinity, and the depression approaches h(ρ s − ρ w )/ (Watts, 2001).
(ρ m − ρ s) (Watts & Ryan, 1976). This is equivalent to
Airy-type isostatic equilibrium and indicates that for
this mechanism to operate the elastic layer and fl uid 2.11.5 Isostatic rebound
substrate must both be very weak.
It can be shown that, for oceanic lithosphere away The equilibrium flexural response of the lithosphere to
from mid-ocean ridges, loads with a half-width of less loading is independent of the precise mechanical prop-
than about 50 km are supported by the fi nite strength erties of the underlying asthenosphere as long as it
of the lithosphere. Loads with half-widths in excess facilitates flow. However, the reattainment of equilib-
of about 500 km are in approximate isostatic equilib- rium after removal of the load, a phenomenon known
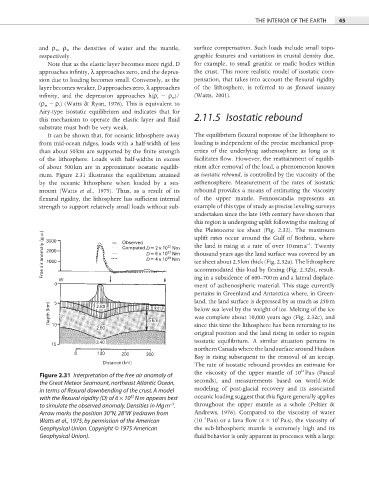
rium. Figure 2.31 illustrates the equilibrium attained as isostatic rebound, is controlled by the viscosity of the
by the oceanic lithosphere when loaded by a sea- asthenosphere. Measurement of the rates of isostatic
mount (Watts et al., 1975). Thus, as a result of its rebound provides a means of estimating the viscosity
flexural rigidity, the lithosphere has suffi cient internal of the upper mantle. Fennoscandia represents an
strength to support relatively small loads without sub- example of this type of study as precise leveling surveys
undertaken since the late 19th century have shown that
this region is undergoing uplift following the melting of
the Pleistocene ice sheet (Fig. 2.32). The maximum
uplift rates occur around the Gulf of Bothnia, where
−1
the land is rising at a rate of over 10 mm a . Twenty
D
D thousand years ago the land surface was covered by an
D ice sheet about 2.5 km thick (Fig. 2.32a). The lithosphere
accommodated this load by flexing (Fig. 2.32b), result-
ing in a subsidence of 600–700 m and a lateral displace-
ment of asthenospheric material. This stage currently
pertains in Greenland and Antarctica where, in Green-
land, the land surface is depressed by as much as 250 m
below sea level by the weight of ice. Melting of the ice
was complete about 10,000 years ago (Fig. 2.32c), and
since this time the lithosphere has been returning to its
original position and the land rising in order to regain
isostatic equilibrium. A similar situation pertains in
northern Canada where the land surface around Hudson
Bay is rising subsequent to the removal of an icecap.
The rate of isostatic rebound provides an estimate for
21
the viscosity of the upper mantle of 10 Pa s (Pascal
Figure 2.31 Interpretation of the free air anomaly of
seconds), and measurements based on world-wide
the Great Meteor Seamount, northeast Atlantic Ocean,
in terms of flexural downbending of the crust. A model modeling of post-glacial recovery and its associated
22
with the flexural rigidity (D) of 6 × 10 N m appears best oceanic loading suggest that this figure generally applies
−3
to simulate the observed anomaly. Densities in Mg m . throughout the upper mantle as a whole (Peltier &
Arrow marks the position 30°N, 28°W (redrawn from Andrews, 1976). Compared to the viscosity of water
3
−3
Watts et al., 1975, by permission of the American (10 Pa s) or a lava fl ow (4 × 10 Pa s), the viscosity of
Geophysical Union. Copyright © 1975 American the sub-lithospheric mantle is extremely high and its
Geophysical Union). fluid behavior is only apparent in processes with a large