
Page 145 - Glucose Monitoring Devices
P. 145
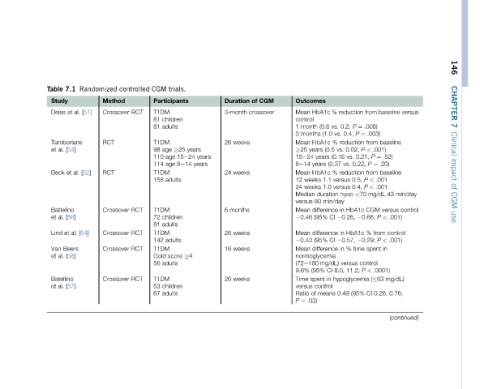
146    CHAPTER 7 Clinical impact of CGM use


                                 versus                min/day  control                   (continued)

                                 baseline  baseline  .52)  .20)  baseline  .001  .001  43  versus  .001)  <  control  .001)  <  in  .0001)  mg/dL)  0.76;  0.26,


                                 from  .008)  .003)  ¼  from  .001)  <  P  ¼  P  0.21,  ¼  P  from  <  P  <  P  mg/dL  <70  CGM  P   0.66;  from  %  P   0.29;  spent  control  <  P  ( 63  CI
                                 reduction  ¼  P  0.2,  P  0.4,  reduction  0.02,  vs.  0.22,  vs.  reduction  0.5,  0.4,  hypo  HbA1c   0.26,  HbA1c   0.57,  time  %  versus  11.2;  hypoglycemia  (95%  0.49


                                 %   vs.  (0.6  vs.  (1.0  %  vs.  (0.5  (0.18  (0.37  %  versus  1.1  versus  1.0  duration  min/day  in difference  CI  in difference  CI  in difference  mg/dL)  8.0,  CI  in  control  means
                              Outcomes  HbA1c  Mean  control  month  1  months  3  HbA1c  Mean  years   25  years  15e24  years  8e14  HbA1c  Mean  weeks  12  weeks  24  Median  80  versus  Mean  (95%   0.46  Mean  (95%   0.43  Mean  normoglycemia  (72e180  (95%  9.6%  spent  Time  versus  of  Ratio  .03)  ¼  P


                              CGM  crossover

                              of
                              Duration  3-month  weeks  26  weeks  24  months  6  weeks  26  weeks  16  weeks  26


                                             years  years
                                           years  15e24                  4

                          trials.  Participants  children  adults   25  age  8e14  age  adults  children  adults  adults  score  adults  children  adults

                          CGM    T1DM  81  81  T1DM  age  98  110  114  T1DM  158  T1DM  72  81  T1DM  142  T1DM  Gold  56  T1DM  53  67

                          controlled  RCT Crossover         RCT Crossover  RCT Crossover  RCT Crossover  RCT Crossover


                          Randomized  Method  [51]  RCT  RCT  [52]


                          7.1    al.  et  Tamborlane  [53]  al.  et  Battelino  [56]  [54]  al.  et  Beers  [58]  [57]
                          Table  Study  Deiss  al.  et  Beck  al.  et  Lind  Van  al.  et  Batellino  al.  et