
Page 48 - Glucose Monitoring Devices
P. 48
Clinical evaluation of SMBG systems 45
was considered a “gold standard” in industry supported publications. A recent
review of analytical and clinical performance of SMBG systems revealed that accu-
racy was assessed most commonly using statistical bias, Bland-Altman plots, and
EGA [4]. Healthcare professionals who had become familiar with EGA began using
the term “clinical implications” to discuss the differences between patient SMBG
and reference BG levels with their patients and colleagues.
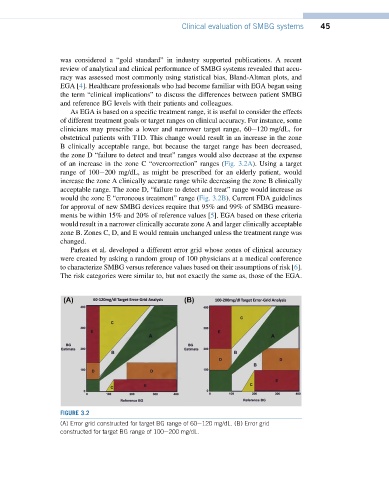
As EGA is based on a specific treatment range, it is useful to consider the effects
of different treatment goals or target ranges on clinical accuracy. For instance, some
clinicians may prescribe a lower and narrower target range, 60e120 mg/dL, for
obstetrical patients with T1D. This change would result in an increase in the zone
B clinically acceptable range, but because the target range has been decreased,
the zone D “failure to detect and treat” ranges would also decrease at the expense
of an increase in the zone C “overcorrection” ranges (Fig. 3.2A). Using a target
range of 100e200 mg/dL, as might be prescribed for an elderly patient, would
increase the zone A clinically accurate range while decreasing the zone B clinically
acceptable range. The zone D, “failure to detect and treat” range would increase as
would the zone E “erroneous treatment” range (Fig. 3.2B). Current FDA guidelines
for approval of new SMBG devices require that 95% and 99% of SMBG measure-
ments be within 15% and 20% of reference values [5]. EGA based on these criteria
would result in a narrower clinically accurate zone A and larger clinically acceptable
zone B. Zones C, D, and E would remain unchanged unless the treatment range was
changed.
Parkes et al. developed a different error grid whose zones of clinical accuracy
were created by asking a random group of 100 physicians at a medical conference
to characterize SMBG versus reference values based on their assumptions of risk [6].
The risk categories were similar to, but not exactly the same as, those of the EGA.
FIGURE 3.2
(A) Error grid constructed for target BG range of 60e120 mg/dL. (B) Error grid
constructed for target BG range of 100e200 mg/dL.