
Page 45 - Green Building Through Integrated Design
P. 45
HIGH-PERFORMANCE BUILDING CHARACTERISTICS 23
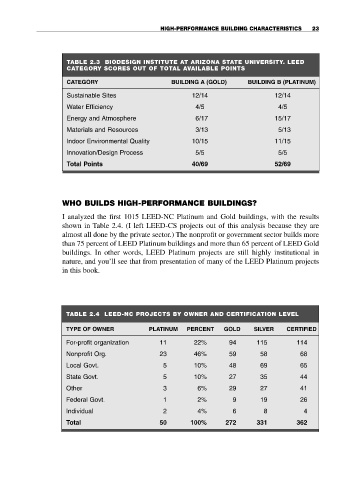
TABLE 2.3 BIODESIGN INSTITUTE AT ARIZONA STATE UNIVERSITY, LEED
CATEGORY SCORES OUT OF TOTAL AVAILABLE POINTS
CATEGORY BUILDING A (GOLD) BUILDING B (PLATINUM)
Sustainable Sites 12/14 12/14
Water Efficiency 4/5 4/5
Energy and Atmosphere 6/17 15/17
Materials and Resources 3/13 5/13
Indoor Environmental Quality 10/15 11/15
Innovation/Design Process 5/5 5/5
Total Points 40/69 52/69
WHO BUILDS HIGH-PERFORMANCE BUILDINGS?
I analyzed the first 1015 LEED-NC Platinum and Gold buildings, with the results
shown in Table 2.4. (I left LEED-CS projects out of this analysis because they are
almost all done by the private sector.) The nonprofit or government sector builds more
than 75 percent of LEED Platinum buildings and more than 65 percent of LEED Gold
buildings. In other words, LEED Platinum projects are still highly institutional in
nature, and you’ll see that from presentation of many of the LEED Platinum projects
in this book.
TABLE 2.4 LEED-NC PROJECTS BY OWNER AND CERTIFICATION LEVEL
TYPE OF OWNER PLATINUM PERCENT GOLD SILVER CERTIFIED
For-profit organization 11 22% 94 115 114
Nonprofit Org. 23 46% 59 58 68
Local Govt. 5 10% 48 69 65
State Govt. 5 10% 27 35 44
Other 3 6% 29 27 41
Federal Govt. 1 2% 9 19 26
Individual 2 4% 6 8 4
Total 50 100% 272 331 362