
Page 245 -
P. 245
P
T
216 P a r t V : a r t V : T h e G r e e n i n g P r o c e s sh e G r e e n i n g P r o c e s s
216
Also, many IT managers are deciding to move to Linux and other free operating
systems, rather than pay a charge for each server. As such, there’s even more demand for
a large number of low-end servers.
Growth
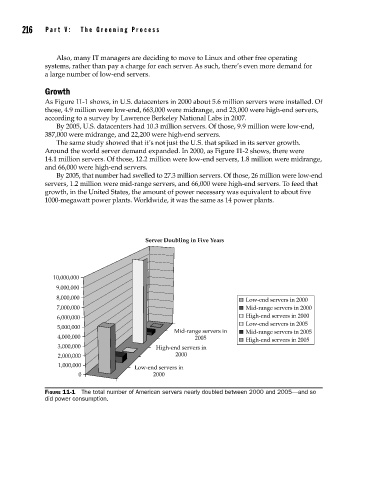
As Figure 11-1 shows, in U.S. datacenters in 2000 about 5.6 million servers were installed. Of
those, 4.9 million were low-end, 663,000 were midrange, and 23,000 were high-end servers,
according to a survey by Lawrence Berkeley National Labs in 2007.
By 2005, U.S. datacenters had 10.3 million servers. Of those, 9.9 million were low-end,
387,000 were midrange, and 22,200 were high-end servers.
The same study showed that it’s not just the U.S. that spiked in its server growth.
Around the world server demand expanded. In 2000, as Figure 11-2 shows, there were
14.1 million servers. Of those, 12.2 million were low-end servers, 1.8 million were midrange,
and 66,000 were high-end servers.
By 2005, that number had swelled to 27.3 million servers. Of those, 26 million were low-end
servers, 1.2 million were mid-range servers, and 66,000 were high-end servers. To feed that
growth, in the United States, the amount of power necessary was equivalent to about five
1000-megawatt power plants. Worldwide, it was the same as 14 power plants.
Server Doubling in Five Years
10,000,000
9,000,000
8,000,000 Low-end servers in 2000
7,000,000 Mid-range servers in 2000
6,000,000 High-end servers in 2000
Low-end servers in 2005
5,000,000
Mid-range servers in Mid-range servers in 2005
4,000,000 2005 High-end servers in 2005
3,000,000 High-end servers in
2,000,000 2000
1,000,000 Low-end servers in
0 2000
FIGURE 11-1 The total number of American servers nearly doubled between 2000 and 2005—and so
did power consumption.