
Page 40 -
P. 40
O
C
C h a p t e r 1 : h a p t e r 1 : O v e r v i e w a n d I s s u e s v e r v i e w a n d I s s u e s 11 11
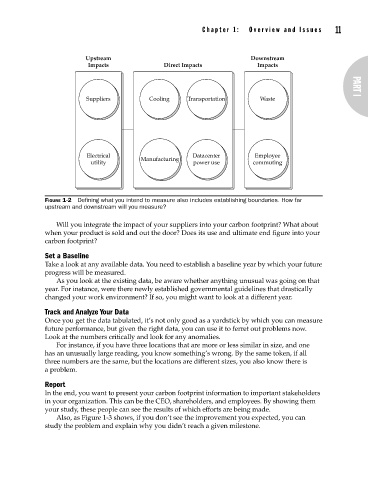
Upstream Downstream
Impacts Direct Impacts Impacts
Suppliers Cooling Transportation Waste PART I
PART I
PART I
Electrical Manufacturing Datacenter Employee
utility power use commuting
FIGURE 1-2 Defining what you intend to measure also includes establishing boundaries. How far
upstream and downstream will you measure?
Will you integrate the impact of your suppliers into your carbon footprint? What about
when your product is sold and out the door? Does its use and ultimate end figure into your
carbon footprint?
Set a Baseline
Take a look at any available data. You need to establish a baseline year by which your future
progress will be measured.
As you look at the existing data, be aware whether anything unusual was going on that
year. For instance, were there newly established governmental guidelines that drastically
changed your work environment? If so, you might want to look at a different year.
Track and Analyze Your Data
Once you get the data tabulated, it’s not only good as a yardstick by which you can measure
future performance, but given the right data, you can use it to ferret out problems now.
Look at the numbers critically and look for any anomalies.
For instance, if you have three locations that are more or less similar in size, and one
has an unusually large reading, you know something’s wrong. By the same token, if all
three numbers are the same, but the locations are different sizes, you also know there is
a problem.
Report
In the end, you want to present your carbon footprint information to important stakeholders
in your organization. This can be the CEO, shareholders, and employees. By showing them
your study, these people can see the results of which efforts are being made.
Also, as Figure 1-3 shows, if you don’t see the improvement you expected, you can
study the problem and explain why you didn’t reach a given milestone.