
Page 210 -
P. 210
182 • Green Project Management
taBle 10.2
Manufacturing and Service Wastes
Waste type Manufacturing Section Wastes Service Sector Wastes
Defects Scrap, rework, replacement Order entry, design, engineering
production, reinspection errors
Waiting Stock-outs, lot processing System downtime, response time,
delays, equipment downtime, approvals
capacity bottlenecks
Overproduction Manufacturing items for which Printing paperwork, purchasing
there are no orders items before they are needed,
processing paperwork before the
next person is ready for it
Transportation Transporting WIP long Multiple sites outside of walking
distances, tracking to and from distance, off-site training
an off-site storage facility
Inventory Excess raw material, WIP, or Office supplies, sales literature,
unfinished goods and reports
Complexity More parts, process steps, or Reentry of data, extra copies,
time than necessary to meet excessive reporting, etc.
customer needs
Unused creativity Lost time, ideas, skills, Limited tools or authority
improvements, and available to employees to carry
suggestions from employees out basic tasks
Note: Courtesy of the U.S. EPA.
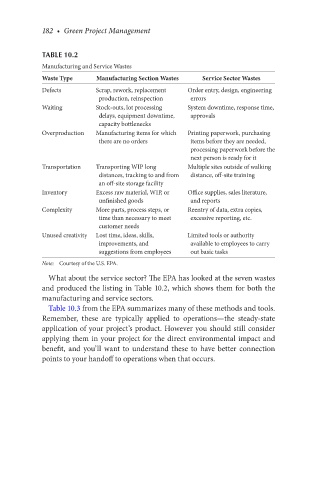
What about the service sector? The EPA has looked at the seven wastes
and produced the listing in Table 10.2, which shows them for both the
manufacturing and service sectors.
Table 10.3 from the EPA summarizes many of these methods and tools.
Remember, these are typically applied to operations—the steady-state
application of your project’s product. However you should still consider
applying them in your project for the direct environmental impact and
benefit, and you’ll want to understand these to have better connection
points to your handoff to operations when that occurs.