
Page 353 - Handbook of Thermal Analysis of Construction Materials
P. 353
330 Chapter 8 - Supplementary Cementing Materials
th
th
th
the 16 to 18 to siline gels (P–R), the 19 was silica gel (S), and the 20 th
nd
to 22 (T–V) were chemical glasses. All these mixtures were cured for 400
days at 20°C. There are differences in the intensity of various peaks and
some of them do not exhibit the high temperature exotherm. The endother-
mal effect at 140–170°C is caused by the dehydration of the bound water
from the C-S-H (I) phase. The endothermal peak at 560°C is due to the
decomposition of the Ca(OH) . Most mixes have calcium hydroxide in
2
them. There is also an endothermal effect at 800–900°C representing the
decomposition of CaCO . The high temperature exothermic peaks above
3
800°C indicate the development of wollastonite or β-C S.
2
In the study of the lime-natural pozzolan systems, lime-rich and
lime-poor calcium silicate hydrates have been differentiated by DTA. [74]
The endothermal peak at 90°C was attributed to the lime-rich C-S-H phase,
and that at 125°C, to the lime-poor C-S-H phase. An exothermic peak that
appears in this system at about 850°C is caused by the crystallization of
wollastonite.
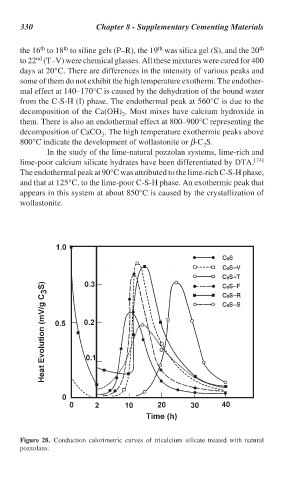
Figure 28. Conduction calorimetric curves of tricalcium silicate treated with natural
pozzolans.