
Page 428 - Handbook of Thermal Analysis of Construction Materials
P. 428
Section 2.0 - Calcium Aluminate Cements 405
2.2 Thermal Analysis of Hydrated Calcium Aluminate
Cements
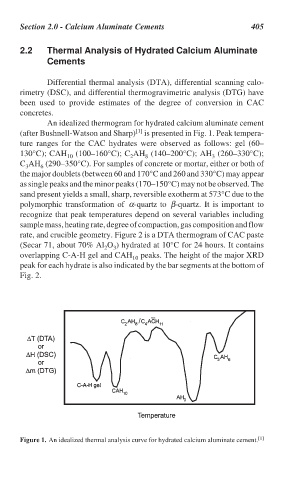
Differential thermal analysis (DTA), differential scanning calo-
rimetry (DSC), and differential thermogravimetric analysis (DTG) have
been used to provide estimates of the degree of conversion in CAC
concretes.
An idealized thermogram for hydrated calcium aluminate cement
[1]
(after Bushnell-Watson and Sharp) is presented in Fig. 1. Peak tempera-
ture ranges for the CAC hydrates were observed as follows: gel (60–
130°C); CAH (100–160°C); C AH (140–200°C); AH (260–330°C);
3
8
2
10
C AH (290–350°C). For samples of concrete or mortar, either or both of
3 6
the major doublets (between 60 and 170°C and 260 and 330°C) may appear
as single peaks and the minor peaks (170–150°C) may not be observed. The
sand present yields a small, sharp, reversible exotherm at 573°C due to the
polymorphic transformation of α-quartz to β-quartz. It is important to
recognize that peak temperatures depend on several variables including
sample mass, heating rate, degree of compaction, gas composition and flow
rate, and crucible geometry. Figure 2 is a DTA thermogram of CAC paste
(Secar 71, about 70% Al O ) hydrated at 10°C for 24 hours. It contains
2 3
overlapping C-A-H gel and CAH peaks. The height of the major XRD
10
peak for each hydrate is also indicated by the bar segments at the bottom of
Fig. 2.
Figure 1. An idealized thermal analysis curve for hydrated calcium aluminate cement. [1]