
Page 479 - Handbook of Thermal Analysis of Construction Materials
P. 479
454 Chapter 11 - Gypsum and Gypsum Products
3.0 THERMOGRAVIMETRIC ANALYSIS (TG)
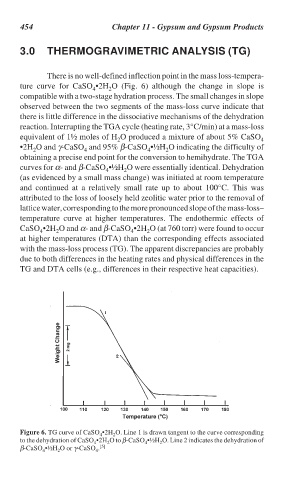
There is no well-defined inflection point in the mass loss-tempera-
ture curve for CaSO •2H O (Fig. 6) although the change in slope is
4 2
compatible with a two-stage hydration process. The small changes in slope
observed between the two segments of the mass-loss curve indicate that
there is little difference in the dissociative mechanisms of the dehydration
reaction. Interrupting the TGA cycle (heating rate, 3°C/min) at a mass-loss
equivalent of 1½ moles of H O produced a mixture of about 5% CaSO 4
2
•2H O and γ-CaSO and 95% β-CaSO •½H O indicating the difficulty of
2 4 4 2
obtaining a precise end point for the conversion to hemihydrate. The TGA
curves for α- and β-CaSO •½H O were essentially identical. Dehydration
4 2
(as evidenced by a small mass change) was initiated at room temperature
and continued at a relatively small rate up to about 100°C. This was
attributed to the loss of loosely held zeolitic water prior to the removal of
lattice water, corresponding to the more pronounced slope of the mass-loss–
temperature curve at higher temperatures. The endothermic effects of
CaSO •2H O and α- and β-CaSO •2H O (at 760 torr) were found to occur
4 2 4 2
at higher temperatures (DTA) than the corresponding effects associated
with the mass-loss process (TG). The apparent discrepancies are probably
due to both differences in the heating rates and physical differences in the
TG and DTA cells (e.g., differences in their respective heat capacities).
Figure 6. TG curve of CaSO •2H O. Line 1 is drawn tangent to the curve corresponding
4 2
to the dehydration of CaSO •2H O to β-CaSO •½H O. Line 2 indicates the dehydration of
2
4
2
4
β-CaSO •½H O or γ-CaSO . [5]
4 2 4