Page 305 - HVAC Pump Handbook
P. 305

Rishel_CH10.qxd  21/4/06  6:20 PM  Page 302


                                   Basics of Pump Application for HVAC Systems

                    302   The HVAC World


                      160

                                                       100% Capacity
                                                       pump
                      140
                                              60%             Possible 75%
                                  50%
                                                     70%      capacity pump
                                      70%
                                                             80%
                      120                    80%
                                                                       86%
                                               84%
                            50% Capacity
                            pump                   86%                        89%
                      100           Efficiency is

                      Pump head—ft.  80  86.5% at 1500 GPM


                                              Efficiency is
                                              89.2% at 3000 GPM


                       60
                                System head curve
                                for one 50%
                                capacity pump
                                                              System head curve
                       40                                     for two 50% or one
                                                              100% capacity pumps


                       20


                        0
                         0        500      1000     1500     2000     2500      3000
                                               System flow—GPM
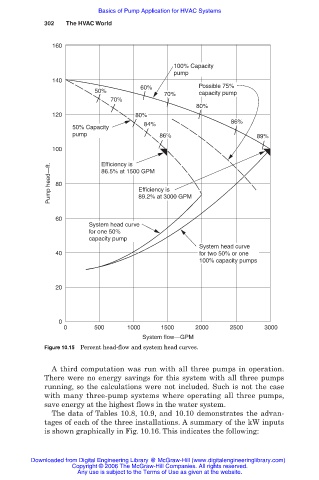
                    Figure 10.15 Percent head-flow and system head curves.


                      A third computation was run with all three pumps in operation.
                    There were no energy savings for this system with all three pumps
                    running, so the calculations were not included. Such is not the case
                    with many three-pump systems where operating all three pumps,
                    save energy at the highest flows in the water system.
                      The data of Tables 10.8, 10.9, and 10.10 demonstrates the advan-
                    tages of each of the three installations. A summary of the kW inputs
                    is shown graphically in Fig. 10.16. This indicates the following:


                 Downloaded from Digital Engineering Library @ McGraw-Hill (www.digitalengineeringlibrary.com)
                            Copyright © 2006 The McGraw-Hill Companies. All rights reserved.
                             Any use is subject to the Terms of Use as given at the website.
   300   301   302   303   304   305   306   307   308   309   310