
Page 31 - Handbook Of Multiphase Flow Assurance
P. 31
Hardware cost 25
An asset similar to the Na-Kika semi-submersible platform with several gas and gas con-
densate fields producing to the common host Independence is operated by Anadarko.
However, an oil company venturing into deepwater must first be able to find the oil before
flow assurance analysis gets done. As a recent example, the largest US exploration and pro-
duction operator had to exit its deepwater exploration business in 2015 as the costs of several
dry hole wells which didn't strike commercial oil quantities and the subsequent contractual
costs of the drilling rig termination amounted to near one billion dollars (Conoco, 2016a,b).
The deepwater assets also range in quality and range from top-tier assess such as Na-Kika or
Atlantis, to technology-intensive and risky Paleogene assets which often carry the whole range
of flow assurance fluid problems such as high oil density, asphaltenes, wax, scale and hydrates.
ILX is key, but we also need to be smart about how we produce and process multiple flu-
ids because fluids may be incompatible and create flow assurance problems when mixed or
comingled.
Flow assurance analysis of multiphase flow stability and flowline sizing analysis, together
with reservoir model, define production rates and the project NPV. Flow assurance has the
tools to optimize the project and to deliver production reliably from nearly any distance.
However, average installed cost for longer subsea tiebacks has been getting progressively
more expensive in the past. This is not a recent but a sustained trend.
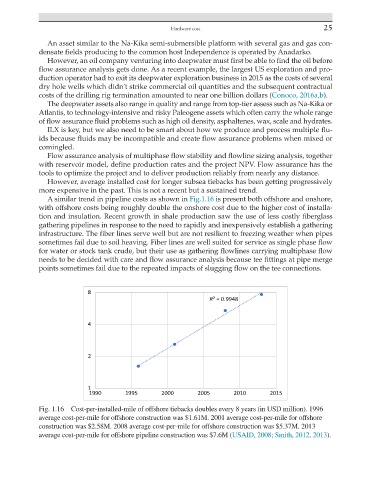
A similar trend in pipeline costs as shown in Fig.1.16 is present both offshore and onshore,
with offshore costs being roughly double the onshore cost due to the higher cost of installa-
tion and insulation. Recent growth in shale production saw the use of less costly fiberglass
gathering pipelines in response to the need to rapidly and inexpensively establish a gathering
infrastructure. The fiber lines serve well but are not resilient to freezing weather when pipes
sometimes fail due to soil heaving. Fiber lines are well suited for service as single phase flow
for water or stock tank crude, but their use as gathering flowlines carrying multiphase flow
needs to be decided with care and flow assurance analysis because tee fittings at pipe merge
points sometimes fail due to the repeated impacts of slugging flow on the tee connections.
8
R² = 0.9948
4
2
1
1990 1995 2000 2005 2010 2015
Fig. 1.16 Cost-per-installed-mile of offshore tiebacks doubles every 8 years (in USD million). 1996
average cost-per-mile for offshore construction was $1.61M. 2001 average cost-per-mile for offshore
construction was $2.58M. 2008 average cost-per-mile for offshore construction was $5.37M. 2013
average cost-per-mile for offshore pipeline construction was $7.6M (USAID, 2008; Smith, 2012, 2013).