
Page 33 - Handbook Of Multiphase Flow Assurance
P. 33
Hardware cost 27
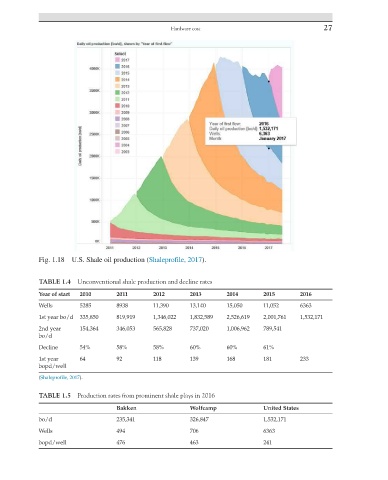
Fig. 1.18 U.S. Shale oil production (Shaleprofile, 2017).
TABLE 1.4 Unconventional shale production and decline rates
Year of start 2010 2011 2012 2013 2014 2015 2016
Wells 5285 8938 11,390 13,140 15,050 11,052 6363
1st year bo/d 335,850 819,919 1,346,022 1,832,589 2,526,619 2,001,761 1,532,171
2nd year 154,364 346,053 565,828 737,020 1,006,962 789,541
bo/d
Decline 54% 58% 58% 60% 60% 61%
1st year 64 92 118 139 168 181 233
bopd/well
(Shaleprofile, 2017).
TABLE 1.5 Production rates from prominent shale plays in 2016
Bakken Wolfcamp United States
bo/d 235,341 326,847 1,532,171
Wells 494 706 6363
bopd/well 476 463 241