
Page 224 - Handbook of Thermal Analysis of Construction Materials
P. 224
206 Chapter 5 - Accelerating Admixtures
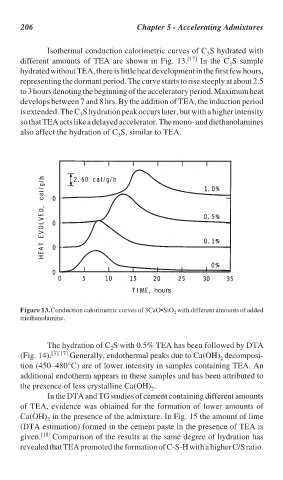
Isothermal conduction calorimetric curves of C S hydrated with
3
different amounts of TEA are shown in Fig. 13. [17] In the C S sample
3
hydrated without TEA, there is little heat development in the first few hours,
representing the dormant period. The curve starts to rise steeply at about 2.5
to 3 hours denoting the beginning of the acceleratory period. Maximum heat
develops between 7 and 8 hrs. By the addition of TEA, the induction period
is extended. The C S hydration peak occurs later, but with a higher intensity
3
so that TEA acts like a delayed accelerator. The mono- and diethanolamines
also affect the hydration of C S, similar to TEA.
3
Figure 13. Conduction calorimetric curves of 3CaO•SiO with different amounts of added
2
triethanolamine.
The hydration of C S with 0.5% TEA has been followed by DTA
2
(Fig. 14). [3][17] Generally, endothermal peaks due to Ca(OH) decomposi-
2
tion (450–480°C) are of lower intensity in samples containing TEA. An
additional endotherm appears in these samples and has been attributed to
the presence of less crystalline Ca(OH) .
2
In the DTA and TG studies of cement containing different amounts
of TEA, evidence was obtained for the formation of lower amounts of
Ca(OH) in the presence of the admixture. In Fig. 15 the amount of lime
2
(DTA estimation) formed in the cement paste in the presence of TEA is
given. [18] Comparison of the results at the same degree of hydration has
revealed that TEA promoted the formation of C-S-H with a higher C/S ratio.