
Page 271 - Handbook of Thermal Analysis of Construction Materials
P. 271
Section 9.0 - Abnormal Setting 251
9.0 ABNORMAL SETTING
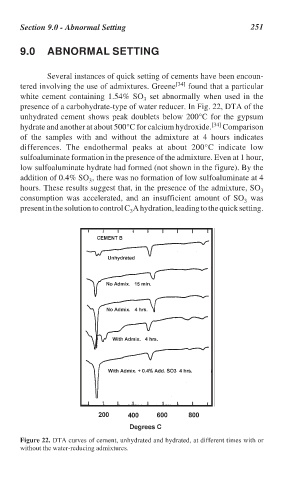
Several instances of quick setting of cements have been encoun-
tered involving the use of admixtures. Greene [34] found that a particular
white cement containing 1.54% SO set abnormally when used in the
3
presence of a carbohydrate-type of water reducer. In Fig. 22, DTA of the
unhydrated cement shows peak doublets below 200°C for the gypsum
hydrate and another at about 500°C for calcium hydroxide. [34] Comparison
of the samples with and without the admixture at 4 hours indicates
differences. The endothermal peaks at about 200°C indicate low
sulfoaluminate formation in the presence of the admixture. Even at 1 hour,
low sulfoaluminate hydrate had formed (not shown in the figure). By the
addition of 0.4% SO , there was no formation of low sulfoaluminate at 4
3
hours. These results suggest that, in the presence of the admixture, SO
3
consumption was accelerated, and an insufficient amount of SO was
3
present in the solution to control C A hydration, leading to the quick setting.
3
Figure 22. DTA curves of cement, unhydrated and hydrated, at different times with or
without the water-reducing admixtures.