
Page 438 - Handbook of Battery Materials
P. 438
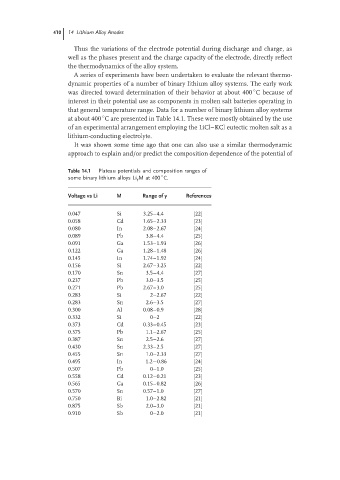
410  14 Lithium Alloy Anodes

                      Thus the variations of the electrode potential during discharge and charge, as
                    well as the phases present and the charge capacity of the electrode, directly reflect
                    the thermodynamics of the alloy system.
                      A series of experiments have been undertaken to evaluate the relevant thermo-
                    dynamic properties of a number of binary lithium alloy systems. The early work
                                                                         ◦
                    was directed toward determination of their behavior at about 400 C because of
                    interest in their potential use as components in molten salt batteries operating in
                    that general temperature range. Data for a number of binary lithium alloy systems
                    at about 400 C are presented in Table 14.1. These were mostly obtained by the use
                              ◦
                    of an experimental arrangement employing the LiCl–KCl eutectic molten salt as a
                    lithium-conducting electrolyte.
                      It was shown some time ago that one can also use a similar thermodynamic
                    approach to explain and/or predict the composition dependence of the potential of

                    Table 14.1  Plateau potentials and composition ranges of
                                               ◦
                    some binary lithium alloys Li y M at 400 C.
                    Voltage vs Li  M     Range of y   References

                    0.047         Si      3.25–4.4      [22]
                    0.058         Cd      1.65–2.33     [23]
                    0.080         In      2.08–2.67     [24]
                    0.089         Pb      3.8–4.4       [25]
                    0.091         Ga      1.53–1.93     [26]
                    0.122         Ga      1.28–1.48     [26]
                    0.145         In      1.74–1.92     [24]
                    0.156         Si      2.67–3.25     [22]
                    0.170         Sn      3.5–4.4       [27]
                    0.237         Pb      3.0–3.5       [25]
                    0.271         Pb      2.67–3.0      [25]
                    0.283         Si        2–2.67      [22]
                    0.283         Sn      2.6–3.5       [27]
                    0.300         Al      0.08–0.9      [28]
                    0.332         Si        0–2         [22]
                    0.373         Cd      0.33–0.45     [23]
                    0.375         Pb      1.1–2.67      [25]
                    0.387         Sn      2.5–2.6       [27]
                    0.430         Sn      2.33–2.5      [27]
                    0.455         Sn      1.0–2.33      [27]
                    0.495         In      1.2−0.86      [24]
                    0.507         Pb        0–1.0       [25]
                    0.558         Cd      0.12–0.21     [23]
                    0.565         Ga      0.15–0.82     [26]
                    0.570         Sn      0.57–1.0      [27]
                    0.750         Bi      1.0–2.82      [21]
                    0.875         Sb      2.0–3.0       [21]
                    0.910         Sb        0–2.0       [21]