
Page 425 - Handbook of Biomechatronics
P. 425
420 Graham Brooker
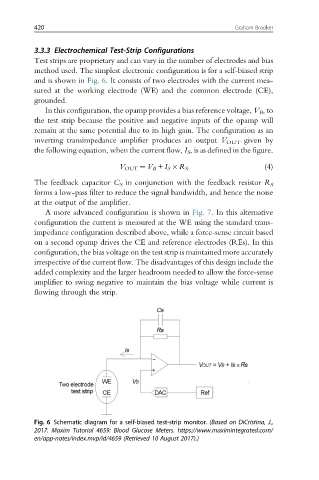
3.3.3 Electrochemical Test-Strip Configurations
Test strips are proprietary and can vary in the number of electrodes and bias
method used. The simplest electronic configuration is for a self-biased strip
and is shown in Fig. 6. It consists of two electrodes with the current mea-
sured at the working electrode (WE) and the common electrode (CE),
grounded.
In this configuration, the opamp provides a bias reference voltage, V B ,to
the test strip because the positive and negative inputs of the opamp will
remain at the same potential due to its high gain. The configuration as an
inverting transimpedance amplifier produces an output V OUT given by
the following equation, when the current flow, I S , is as defined in the figure.
(4)
V OUT ¼ V B + I S R S
The feedback capacitor C S in conjunction with the feedback resistor R S
forms a low-pass filter to reduce the signal bandwidth, and hence the noise
at the output of the amplifier.
A more advanced configuration is shown in Fig. 7. In this alternative
configuration the current is measured at the WE using the standard trans-
impedance configuration described above, while a force-sense circuit based
on a second opamp drives the CE and reference electrodes (REs). In this
configuration, the bias voltage on the test strip is maintained more accurately
irrespective of the current flow. The disadvantages of this design include the
added complexity and the larger headroom needed to allow the force-sense
amplifier to swing negative to maintain the bias voltage while current is
flowing through the strip.
Fig. 6 Schematic diagram for a self-biased test-strip monitor. (Based on DiCristina, J.,
2017. Maxim Tutorial 4659: Blood Glucose Meters. https://www.maximintegrated.com/
en/app-notes/index.mvp/id/4659 (Retrieved 10 August 2017).)