
Page 423 - Handbook of Biomechatronics
P. 423
418 Graham Brooker
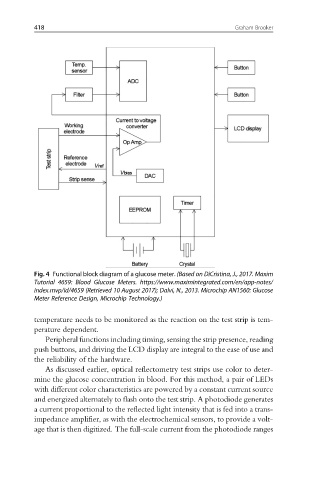
Fig. 4 Functional block diagram of a glucose meter. (Based on DiCristina, J., 2017. Maxim
Tutorial 4659: Blood Glucose Meters. https://www.maximintegrated.com/en/app-notes/
index.mvp/id/4659 (Retrieved 10 August 2017); Dalvi, N., 2013. Microchip AN1560: Glucose
Meter Reference Design, Microchip Technology.)
temperature needs to be monitored as the reaction on the test strip is tem-
perature dependent.
Peripheral functions including timing, sensing the strip presence, reading
push buttons, and driving the LCD display are integral to the ease of use and
the reliability of the hardware.
As discussed earlier, optical reflectometry test strips use color to deter-
mine the glucose concentration in blood. For this method, a pair of LEDs
with different color characteristics are powered by a constant current source
and energized alternately to flash onto the test strip. A photodiode generates
a current proportional to the reflected light intensity that is fed into a trans-
impedance amplifier, as with the electrochemical sensors, to provide a volt-
age that is then digitized. The full-scale current from the photodiode ranges