
Page 152 - Handbook of Civil Engineering Calculations, Second Edition
P. 152
STRUCTURAL STEEL DESIGN 1.135
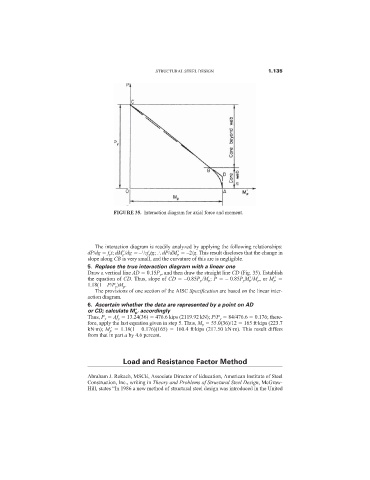
FIGURE 35. Interaction diagram for axial force and moment.
The interaction diagram is readily analyzed by applying the following relationships:
1
dP/dg f y t; dM p
/dg – /2f y tg; dP/dM p
–2/g. This result discloses that the change in
slope along CB is very small, and the curvature of this arc is negligible.
5. Replace the true interaction diagram with a linear one
Draw a vertical line AD 0.15P y , and then draw the straight line CD (Fig. 35). Establish
the equation of CD. Thus, slope of CD –0.85P y /M p ; P – 0.85P y M p
/M p , or M p
1.18(1 – P/P y )M p .
The provisions of one section of the AISC Specification are based on the linear inter-
action diagram.
6. Ascertain whether the data are represented by a point on AD
or CD; calculate M’ p
accordingly
Thus, P y Af y 13.24(36) 476.6 kips (2119.92 kN); P/P y 84/476.6 0.176; there-
fore, apply the last equation given in step 5. Thus, M p 55.0(36)/12 165 ft·kips (223.7
kN·m); M p
1.18(1 – 0.176)(165) 160.4 ft·kips (217.50 kN·m). This result differs
from that in part a by 4.6 percent.
Load and Resistance Factor Method
Abraham J. Rokach, MSCE, Associate Director of Education, American Institute of Steel
Construction, Inc., writing in Theory and Problems of Structural Steel Design, McGraw-
Hill, states “In 1986 a new method of structural steel design was introduced in the United