
Page 396 - Handbook of Energy Engineering Calculations
P. 396
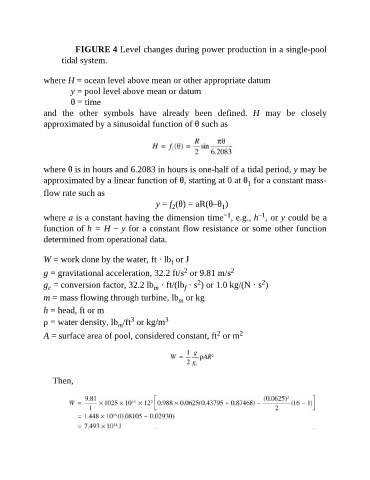
FIGURE 4 Level changes during power production in a single-pool
                     tidal system.

               where H = ocean level above mean or other appropriate datum
                          y = pool level above mean or datum
                          θ = time

               and  the  other  symbols  have  already  been  defined.  H  may  be  closely
               approximated by a sinusoidal function of θ such as


               where θ is in hours and 6.2083 in hours is one-half of a tidal period, y may be
               approximated by a linear function of θ, starting at 0 at θ  for a constant mass-
                                                                                   1
               flow rate such as
                                                    y = f (θ) = aR(θ–θ )
                                                                          1
                                                          2
                                                                                      –1
                                                                           −1
               where a is a constant having the dimension time , e.g., h , or y could be a
               function of h = H − y for a constant flow resistance or some other function
               determined from operational data.


               W = work done by the water, ft · lb  or J
                                                          f
                                                              2
               g = gravitational acceleration, 32.2 ft/s  or 9.81 m/s        2
                                                                  2
                                                                                        2
               g  = conversion factor, 32.2 lb  · ft/(lb  · s ) or 1.0 kg/(N · s )
                 c
                                                              f
                                                    m
               m = mass flowing through turbine, lb  or kg
                                                            m
               h = head, ft or m
                                            3
               ρ = water density, lb /ft  or kg/m       3
                                        m
                                                                         2
               A = surface area of pool, considered constant, ft  or m          2


                  Then,