
Page 35 - Handbook of Gold Exploration and Evaluation
P. 35
Nature and history of gold 17
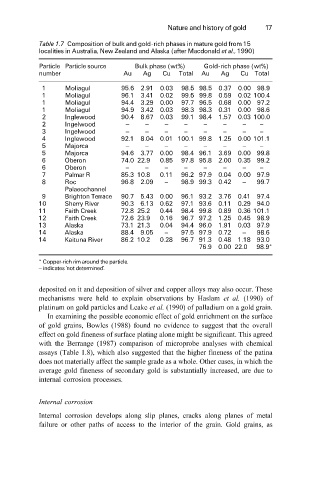
Table 1.7 Composition of bulk and gold-rich phases in mature gold from 15
localities in Australia, New Zealand and Alaska (after Macdonald et al., 1990)
Particle Particle source Bulk phase (wt%) Gold-rich phase (wt%)
number Au Ag Cu Total Au Ag Cu Total
1 Moliagul 95.6 2.91 0.03 98.5 98.5 0.37 0.00 98.9
1 Moliagul 96.1 3.41 0.02 99.5 99.8 0.59 0.02 100.4
1 Moliagul 94.4 3.29 0.00 97.7 96.5 0.68 0.00 97.2
1 Moliagul 94.9 3.42 0.03 98.3 98.3 0.31 0.00 98.6
2 Inglewood 90.4 8.67 0.03 99.1 98.4 1.57 0.03 100.0
2 Ingelwood ± ± ± ± ± ± ± ±
3 Ingelwood ± ± ± ± ± ± ± ±
4 Inglewood 92.1 8.04 0.01 100.1 99.8 1.25 0.00 101.1
5 Majorca ± ± ± ± ± ± ± ±
5 Majorca 94.6 3.77 0.00 98.4 96.1 3.69 0.00 99.8
6 Oberon 74.0 22.9 0.85 97.8 95.8 2.00 0.35 99.2
6 Oberon ± ± ± ± ± ± ± ±
7 Palmar R 85.3 10.8 0.11 96.2 97.9 0.04 0.00 97.9
8 Roc 96.8 2.09 ± 98.9 99.3 0.42 ± 99.7
Palaeochannel
9 Brighton Terrace 90.7 5.43 0.00 96.1 93.2 3.76 0.41 97.4
10 Sherry River 90.3 6.13 0.62 97.1 93.6 0.11 0.29 94.0
11 Faith Creek 72.8 25.2 0.44 98.4 99.8 0.89 0.36 101.1
12 Faith Creek 72.6 23.9 0.16 96.7 97.2 1.25 0.45 98.9
13 Alaska 73.1 21.3 0.04 94.4 96.0 1.91 0.03 97.9
14 Alaska 88.4 9.05 ± 97.5 97.9 0.72 ± 98.6
14 Kaituna River 86.2 10.2 0.28 96.7 91.3 0.48 1.18 93.0
76.9 0.00 22.0 98.9*
* Copper-rich rim around the particle.
± indicates`not determined'.
deposited on it and deposition of silver and copper alloys may also occur. These
mechanisms were held to explain observations by Haslam et al. (1990) of
platinum on gold particles and Leake et al. (1990) of palladium on a gold grain.
In examining the possible economic effect of gold enrichment on the surface
of gold grains, Bowles (1988) found no evidence to suggest that the overall
effect on gold fineness of surface plating alone might be significant. This agreed
with the Berrange (1987) comparison of microprobe analyses with chemical
assays (Table 1.8), which also suggested that the higher fineness of the patina
does not materially affect the sample grade as a whole. Other cases, in which the
average gold fineness of secondary gold is substantially increased, are due to
internal corrosion processes.
Internal corrosion
Internal corrosion develops along slip planes, cracks along planes of metal
failure or other paths of access to the interior of the grain. Gold grains, as