
Page 36 - Handbook of Gold Exploration and Evaluation
P. 36
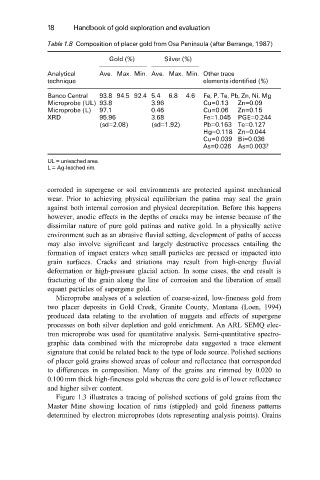
18     Handbook of gold exploration and evaluation

              Table 1.8 Composition of placer gold from Osa Peninsula (after Berrange, 1987)

                               Gold (%)       Silver (%)
              Analytical    Ave. Max. Min. Ave. Max. Min. Other trace
              technique                                  elements identified (%)
              Banco Central  93.8 94.5 92.4 5.4  6.8  4.6  Fe, P, Te, Pb, Zn, Ni, Mg
              Microprobe (UL) 93.8         3.96          Cu=0.13   Zn=0.09
              Microprobe (L)  97.1         0.46          Cu=0.06   Zn=0.15
              XRD           95.96          3.68          Fe=1.045  PGE=0.244
                            (sd=2.08)      (sd=1.92)     Pb=0.163 Te=0.127
                                                         Hg=0.118 Zn=0.044
                                                         Cu=0.039 Bi=0.036
                                                         As=0.026  As=0.003?
              UL = unleached area.
              L = Ag-leached rim.


              corroded in supergene or soil environments are protected against mechanical
              wear. Prior to achieving physical equilibrium the patina may seal the grain
              against both internal corrosion and physical decrepitation. Before this happens
              however, anodic effects in the depths of cracks may be intense because of the
              dissimilar nature of pure gold patinas and native gold. In a physically active
              environment such as an abrasive fluvial setting, development of paths of access
              may also involve significant and largely destructive processes entailing the
              formation of impact craters when small particles are pressed or impacted into
              grain surfaces. Cracks and striations may result from high-energy fluvial
              deformation or high-pressure glacial action. In some cases, the end result is
              fracturing of the grain along the line of corrosion and the liberation of small
              equant particles of supergene gold.
                 Microprobe analyses of a selection of coarse-sized, low-fineness gold from
              two placer deposits in Gold Creek, Granite County, Montana (Loen, 1994)
              produced data relating to the evolution of nuggets and effects of supergene
              processes on both silver depletion and gold enrichment. An ARL SEMQ elec-
              tron microprobe was used for quantitative analysis. Semi-quantitative spectro-
              graphic data combined with the microprobe data suggested a trace element
              signature that could be related back to the type of lode source. Polished sections
              of placer gold grains showed areas of colour and reflectance that corresponded
              to differences in composition. Many of the grains are rimmed by 0.020 to
              0.100 mm thick high-fineness gold whereas the core gold is of lower reflectance
              and higher silver content.
                 Figure 1.3 illustrates a tracing of polished sections of gold grains from the
              Master Mine showing location of rims (stippled) and gold fineness patterns
              determined by electron microprobes (dots representing analysis points). Grains