
Page 52 - Handbook of Natural Gas Transmission and Processing Principles and Practices
P. 52
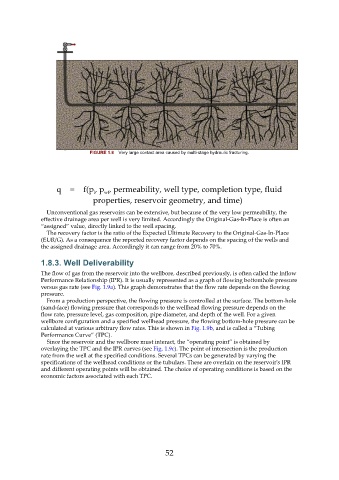
FIGURE 1.8  Very large contact area caused by multi-stage hydraulic fracturing.


                     q    =    f(p , p , permeability, well type, completion type, fluid
                                      wf
                                  i
                                  properties, reservoir geometry, and time)
                 Unconventional gas reservoirs can be extensive, but because of the very low permeability, the
               effective drainage area per well is very limited. Accordingly the Original-Gas-In-Place is often an
               “assigned” value, directly linked to the well spacing.
                 The recovery factor is the ratio of the Expected Ultimate Recovery to the Original-Gas-In-Place
               (EUR/G). As a consequence the reported recovery factor depends on the spacing of the wells and
               the assigned drainage area. Accordingly it can range from 20% to 70%.

               1.8.3. Well Deliverability
               The flow of gas from the reservoir into the wellbore, described previously, is often called the Inflow
               Performance Relationship (IPR). It is usually represented as a graph of flowing bottomhole pressure
               versus gas rate (see Fig. 1.9a). This graph demonstrates that the flow rate depends on the flowing
               pressure.
                 From a production perspective, the flowing pressure is controlled at the surface. The bottom-hole
               (sand-face) flowing pressure that corresponds to the wellhead flowing pressure depends on the
               flow rate, pressure level, gas composition, pipe diameter, and depth of the well. For a given
               wellbore configuration and a specified wellhead pressure, the flowing bottom-hole pressure can be
               calculated at various arbitrary flow rates. This is shown in Fig. 1.9b, and is called a “Tubing
               Performance Curve” (TPC).
                 Since the reservoir and the wellbore must interact, the “operating point” is obtained by
               overlaying the TPC and the IPR curves (see Fig. 1.9c). The point of intersection is the production
               rate from the well at the specified conditions. Several TPCs can be generated by varying the
               specifications of the wellhead conditions or the tubulars. These are overlain on the reservoir's IPR
               and different operating points will be obtained. The choice of operating conditions is based on the
               economic factors associated with each TPC.


                                                           52