
Page 285 - Handbook of Properties of Textile and Technical Fibres
P. 285
Tensile properties of cotton fibers: importance, research, and limitations 259
straighten the fibers in the sample. For these reasons, using the HVI beard test to
evaluate the strength of cotton fibers that have been processed in the subsequent stages
of spinning preparation is an unusual practice. However, the reason for using the HVI
system in this study was due to the ease of testing in a massive operation. The under-
lying purpose of this study was (1) to determine the trends in beard strength after each
stage of processing and (2) to determine the extent of variation in fiber strength after
every stage of processing. The assumption here is that trends and variability are
directly process related, while actual magnitudes of fiber strength are largely testing
related. Figs. 7.14 and 7.15 show the results of these experiments for two different
processes of spinning preparation: (carded-yarn open-end spinning preparation, and
combed-yarn ring spinning preparation). The results are displayed in the form of the
frequency distribution of bundle strength of all the bales in the cotton mix and of cotton
samples taken after each stage of processing. It should be noted that samples in these
experiments were taken from different processing units (all chute feeds, all cards, all
drawing frames, etc.).
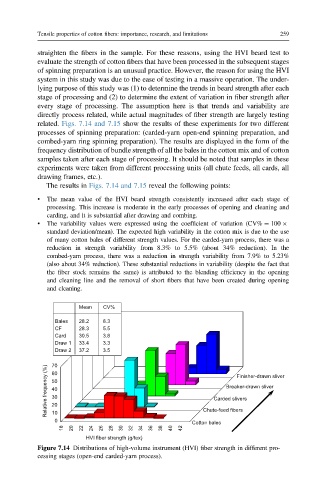
The results in Figs. 7.14 and 7.15 reveal the following points:
• The mean value of the HVI beard strength consistently increased after each stage of
processing. This increase is moderate in the early processes of opening and cleaning and
carding, and it is substantial after drawing and combing.
• The variability values were expressed using the coefficient of variation (CV% ¼ 100
standard deviation/mean). The expected high variability in the cotton mix is due to the use
of many cotton bales of different strength values. For the carded-yarn process, there was a
reduction in strength variability from 8.3% to 5.5% (about 34% reduction). In the
combed-yarn process, there was a reduction in strength variability from 7.9% to 5.23%
(also about 34% reduction). These substantial reductions in variability (despite the fact that
the fiber stock remains the same) is attributed to the blending efficiency in the opening
and cleaning line and the removal of short fibers that have been created during opening
and cleaning.
Mean CV%
Bales 28.2 8.3
CF 28.3 5.5
Card 30.5 3.8
Draw 1 33.4 3.3
Draw 2 37.2 3.5
70 Finisher-drawn sliver
Relative frequency (%) 50 Carded slivers
60
Breaker-drawn sliver
40
30
20
Chute-feed fibers
10
0 Cotton bales
18 20 22 24 26 28 30 32 34 36 38 40 42
HVI fiber strength (g/tex)
Figure 7.14 Distributions of high-volume instrument (HVI) fiber strength in different pro-
cessing stages (open-end carded-yarn process).