
Page 343 - Handbook of Properties of Textile and Technical Fibres
P. 343
316 Handbook of Properties of Textile and Technical Fibres
(a) (b)
(c)
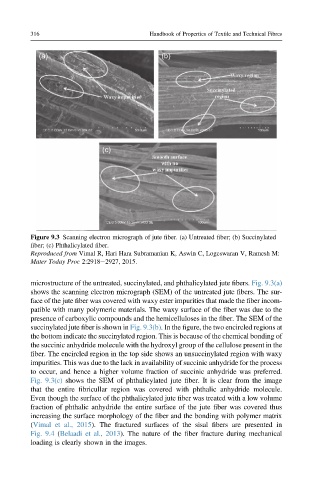
Figure 9.3 Scanning electron micrograph of jute fiber. (a) Untreated fiber; (b) Succinylated
fiber; (c) Phthalicylated fiber.
Reproduced from Vimal R, Hari Hara Subramanian K, Aswin C, Logeswaran V, Ramesh M:
Mater Today Proc 2:2918e2927, 2015.
microstructure of the untreated, succinylated, and phthalicylated jute fibers. Fig. 9.3(a)
shows the scanning electron micrograph (SEM) of the untreated jute fibers. The sur-
face of the jute fiber was covered with waxy ester impurities that made the fiber incom-
patible with many polymeric materials. The waxy surface of the fiber was due to the
presence of carboxylic compounds and the hemicelluloses in the fiber. The SEM of the
succinylated jute fiber is shown in Fig. 9.3(b). In the figure, the two encircled regions at
the bottom indicate the succinylated region. This is because of the chemical bonding of
the succinic anhydride molecule with the hydroxyl group of the cellulose present in the
fiber. The encircled region in the top side shows an unsuccinylated region with waxy
impurities. This was due to the lack in availability of succinic anhydride for the process
to occur, and hence a higher volume fraction of succinic anhydride was preferred.
Fig. 9.3(c) shows the SEM of phthalicylated jute fiber. It is clear from the image
that the entire fibricullar region was covered with phthalic anhydride molecule.
Even though the surface of the phthalicylated jute fiber was treated with a low volume
fraction of phthalic anhydride the entire surface of the jute fiber was covered thus
increasing the surface morphology of the fiber and the bonding with polymer matrix
(Vimal et al., 2015). The fractured surfaces of the sisal fibers are presented in
Fig. 9.4 (Belaadi et al., 2013). The nature of the fiber fracture during mechanical
loading is clearly shown in the images.