
Page 417 - Handbook of Properties of Textile and Technical Fibres
P. 417
390 Handbook of Properties of Textile and Technical Fibres
caused by a strain-reduced modulus followed by a strain-hardening process, due to
molecular orientation (Vincent, 1960).
The required drawing temperature can be partially generated by the inner frictional
heat from drawing (as in PA 6) or by an outer frictional heat (as by the draw pin for PA
66) (Fourné, 1999). The exposure time in the drawing zone is only 10 4 s.
Hot drawing at temperatures above T g is characterized by gradual diameter reduction
without the creation of a neck. A typical phenomenon is an increase of crystallinity
induced by heat, but orientation of polymeric chains increases only gradually.
The basic parameter for the drawing process is the draw ratio, i.e., the ratio between
output and input filament velocity in the drawing zone or the ratio between length of
drawn and undrawn fiber. Usual draw ratios for PA are between 3.4 and 4.5.
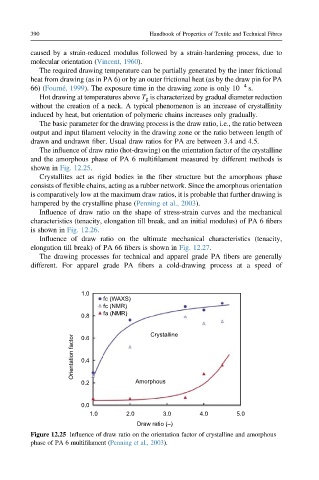
The influence of draw ratio (hot-drawing) on the orientation factor of the crystalline
and the amorphous phase of PA 6 multifilament measured by different methods is
shown in Fig. 12.25.
Crystallites act as rigid bodies in the fiber structure but the amorphous phase
consists of flexible chains, acting as a rubber network. Since the amorphous orientation
is comparatively low at the maximum draw ratios, it is probable that further drawing is
hampered by the crystalline phase (Penning et al., 2003).
Influence of draw ratio on the shape of stress-strain curves and the mechanical
characteristics (tenacity, elongation till break, and an initial modulus) of PA 6 fibers
is shown in Fig. 12.26.
Influence of draw ratio on the ultimate mechanical characteristics (tenacity,
elongation till break) of PA 66 fibers is shown in Fig. 12.27.
The drawing processes for technical and apparel grade PA fibers are generally
different. For apparel grade PA fibers a cold-drawing process at a speed of
1.0
fc (WAXS)
fc (NMR)
0.8 fa (NMR) Crystalline
Orientation factor 0.6
0.4
0.2 Amorphous
0.0
1.0 2.0 3.0 4.0 5.0
Draw ratio (–)
Figure 12.25 Influence of draw ratio on the orientation factor of crystalline and amorphous
phase of PA 6 multifilament (Penning et al., 2003).