
Page 436 - Handbook of Properties of Textile and Technical Fibres
P. 436
The chemistry, manufacture, and tensile behavior of polyamide fibers 409
60
β form
α form
γ form
Engineering stress (MPa) 20
40
0
1 3 5
Extension ratio (–)
Figure 12.35 Stress-strain curve of different crystal phases for PA 6 film at T ¼ 120 C
(Penel-Pierron et al., 2001a).
PA 66 and PA 6 filaments are approximately the same, up to the heat-setting temper-
ature of 160 C. The final modulus is dramatically reduced for PA 6 and PA 66 fibers
preset at 200 C(Vasanthan, 2008).
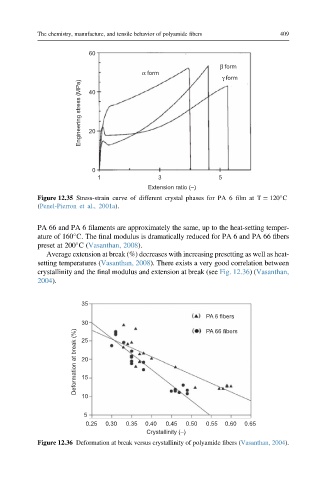
Average extension at break (%) decreases with increasing presetting as well as heat-
setting temperatures (Vasanthan, 2008). There exists a very good correlation between
crystallinity and the final modulus and extension at break (see Fig. 12.36)(Vasanthan,
2004).
35
PA 6 fibers
30 PA 66 fibers
Deformation at break (%) 20
25
15
10
5
0.25 0.30 0.35 0.40 0.45 0.50 0.55 0.60 0.65
Crystallinity (–)
Figure 12.36 Deformation at break versus crystallinity of polyamide fibers (Vasanthan, 2004).