
Page 347 - High Temperature Solid Oxide Fuel Cells Fundamentals, Design and Applications
P. 347
Cell, Stack and System ModeIIing 323
three phases, is represented by a volumetric interfacial reaction area (designated
by a,) with a meaning similar to that of the dimensionless interfacial area factor
a in Eq. (lob). Across the interface represented by a,, the electrochemical
reaction takes place, generating electronic and ionic current fluxes and their
associated potentials, as discussed under Eqs. (35) and (36). The species
concentration and ionic or electronic current fluxes are projected with respect to
the macrohomogeneous electrode cross section. This implies that the volume
fractions of electrocatalyst, electrolyte, and gas-filled pores are necessary
structural parameters, in addition to a,.
The simplification inherent in the 1-D macrohomogeneous model is that of
the microstructure. For the model to be useful in optimising electrode
microstructure, the parameter a, must be related to microstructural
characteristics such as pore size and porosity. There are various techniques
available from percolation theory to accomplish this and relate a, and other
model parameters to empirical pore-size distribution and total pore volume.
One of the advantages of the 1-D macrohomogeneous approach is that
complete diffusion, reaction, and potential profiles are obtained, which is
advantageous when the relative rates of competing reactions (for example,
anodic oxidation of Hz compared with direct anodic oxidation of CO or even
direct anodic oxidation of CH4) are compared. Another advantage is that no a
priori assumption is made about the location of the reaction zone. The zones of
maximum reaction are identified from the current and potential profiles and can
be correlated with structural characteristics and operating variables. FinaIly, the
very general formulation of the fundamentaI equations makes it possible to use
dimensional analysis as a guide in correlating results and fitting against
experimental data [ 5 51.
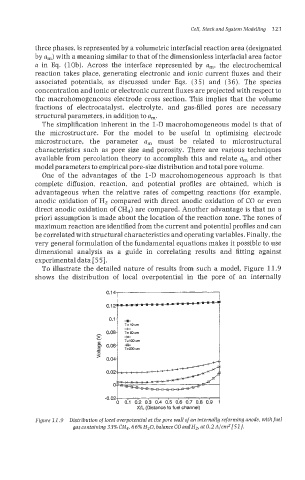
To illustrate the detailed nature of results from such a model, Figure 11.9
shows the distribution of local overpotential in the pore of an internally
-0.021 4 I I I I I I I I 4
0 0.1 0.2 0.3 0.4 0.5 0.6 0.7 0.8 0.9 1
X/L (Distance to fuel channel)
Figure 11.9 Distribution of local overpotential at the pore wall ofan internally reforming anode, withfuel
gascontaining33%CH*, 66% H20, balanceCOandHz,at0.2A/crnZ[51].