
Page 214 - How To Implement Lean Manufacturing
P. 214
192 Cha pte r T w e l v e
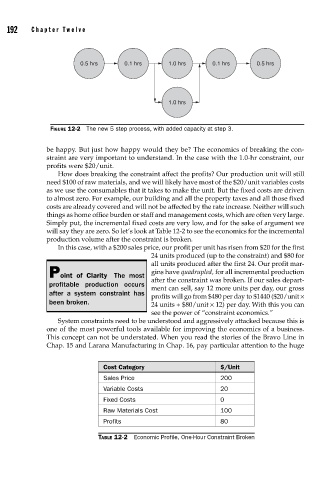
0.5 hrs 0.1 hrs 1.0 hrs 0.1 hrs 0.5 hrs
1.0 hrs
FIGURE 12-2 The new 5 step process, with added capacity at step 3.
be happy. But just how happy would they be? The economics of breaking the con-
straint are very important to understand. In the case with the 1.0-hr constraint, our
profits were $20/unit.
How does breaking the constraint affect the profits? Our production unit will still
need $100 of raw materials, and we will likely have most of the $20/unit variables costs
as we use the consumables that it takes to make the unit. But the fixed costs are driven
to almost zero. For example, our building and all the property taxes and all those fixed
costs are already covered and will not be affected by the rate increase. Neither will such
things as home office burden or staff and management costs, which are often very large.
Simply put, the incremental fixed costs are very low, and for the sake of argument we
will say they are zero. So let’s look at Table 12-2 to see the economics for the incremental
production volume after the constraint is broken.
In this case, with a $200 sales price, our profit per unit has risen from $20 for the first
24 units produced (up to the constraint) and $80 for
all units produced after the first 24. Our profit mar-
gins have quadrupled, for all incremental production
Point of Clarity The most
after the constraint was broken. If our sales depart-
profitable production occurs
ment can sell, say 12 more units per day, our gross
after a system constraint has profits will go from $480 per day to $1440 ($20/unit ×
been broken. 24 units + $80/unit × 12) per day. With this you can
see the power of “constraint economics.”
System constraints need to be understood and aggressively attacked because this is
one of the most powerful tools available for improving the economics of a business.
This concept can not be understated. When you read the stories of the Bravo Line in
Chap. 15 and Larana Manufacturing in Chap. 16, pay particular attention to the huge
Cost Category $/Unit
Sales Price 200
Variable Costs 20
Fixed Costs 0
Raw Materials Cost 100
Profits 80
TABLE 12-2 Economic Profile, One-Hour Constraint Broken