
Page 222 - How To Implement Lean Manufacturing
P. 222
200 Cha pte r T h i r tee n
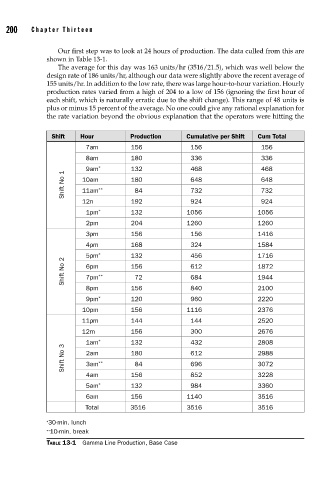
Our first step was to look at 24 hours of production. The data culled from this are
shown in Table 13-1.
The average for this day was 163 units/hr (3516/21.5), which was well below the
design rate of 186 units/hr, although our data were slightly above the recent average of
155 units/hr. In addition to the low rate, there was large hour-to-hour variation. Hourly
production rates varied from a high of 204 to a low of 156 (ignoring the first hour of
each shift, which is naturally erratic due to the shift change). This range of 48 units is
plus or minus 15 percent of the average. No one could give any rational explanation for
the rate variation beyond the obvious explanation that the operators were hitting the
Shift Hour Production Cumulative per Shift Cum Total
7am 156 156 156
8am 180 336 336
9am * 132 468 468
Shift No 1 10am ** 180 648 648
84
732
11am
732
12n 192 924 924
1pm * 132 1056 1056
2pm 204 1260 1260
3pm 156 156 1416
4pm 168 324 1584
5pm * 132 456 1716
Shift No 2 6pm ** 156 612 1872
684
1944
7pm
72
8pm 156 840 2100
9pm * 120 960 2220
10pm 156 1116 2376
11pm 144 144 2520
12m 156 300 2676
1am * 132 432 2808
Shift No 3 2am ** 180 612 2988
696
3072
3am
84
4am 156 852 3228
5am * 132 984 3360
6am 156 1140 3516
Total 3516 3516 3516
∗ 30-min. lunch
∗∗ 10-min. break
TABLE 13-1 Gamma Line Production, Base Case