
Page 223 - How To Implement Lean Manufacturing
P. 223
Cellular Manufacturing 201
delay button. At first glance, the production numbers do not look too bad until we
recall that the design of 186 was based on an OEE of 85 percent, or 15 percent losses due
to quality, availability, and cycle-time losses. The data we analyzed showed:
• Quality losses to be 3.1 percent
• Zero availability losses
• All other losses were cycle-time losses
So what were the cycle-time losses? The design hourly rate at 100 percent efficiency
was 225 units but we produced 163 units so losses were 62 units or 27.6 percent. If qual-
ity and availability losses total 3.1 percent this means cycle time losses total 27.6 percent
–3.1 percent or 24.5 percent … which is huge! With all these losses the effective cycle
time is 22 seconds (21.5 × 3600/3516).
Our design is synchronized externally since we need a 16.4-second cycle time and
have a design of 16 seconds, which supposedly should work nicely. It does not, however,
and the reason it does not work is because the production cycle time is not producing
anywhere near takt × OEE.
So, just what can we do about it?
Well, we need to redesign the production process so it will produce to takt, and to
do that, we will proceed to Strategy 2: Synchronize Production, Internally.
Strategy 2: Synchronize Production, Internally
A New Approach, Multiple Work Cells
We will attack this problem with cellular design, which will directly reduce the varia-
tion and better balance the flow, using multiple cells in our new design.
The questions we must first answer are:
• How many cells?
• How many persons per cell?
• What is the cell layout?
The Time Study and Line Balance Review
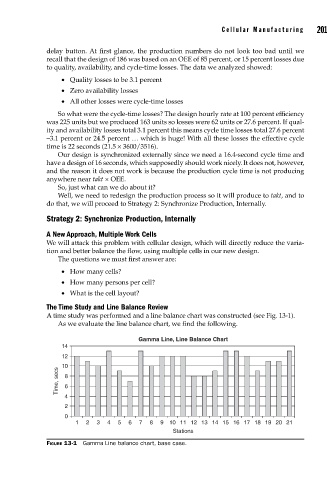
A time study was performed and a line balance chart was constructed (see Fig. 13-1).
As we evaluate the line balance chart, we find the following.
Gamma Line, Line Balance Chart
14
12
10
Time, secs 8 6
4
2
0
1 2 3 4 5 6 7 8 9 10 11 12 13 14 15 16 17 18 19 20 21
Stations
FIGURE 13-1 Gamma Line balance chart, base case.