
Page 235 - How To Implement Lean Manufacturing
P. 235
The Story of the Alpha Line 213
• Create a specific plan to improve the FTY.
• As part of the plan to improve the FTY, one of the action items would need to
be the dismantling of the second rework station.
The metric of FTY became the facility’s measure of internal process quality, and the
key tool to improving the FTY became the use of SPC.
The plant manager had shown excellent leadership in two key areas. First, he had
required that the entire management team know SPC, and then he had created the key
metric for the plant in FTY. Next, he set about supplying all the needed training. Opera-
tors were taught how to take data, make Xbar-R chart calculations, and plot the data.
They were also taught how to read the charts for special causes (1 point beyond +/–3
sigma, runs and trends, for example) and then the operators would solicit assistance for
out-of-control conditions from their supervisor. Supervisors and engineers were taught
the necessary problem solving skills, plus how and when to recalculate limits and gen-
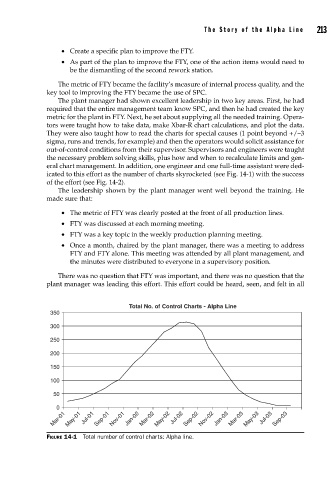
eral chart management. In addition, one engineer and one full-time assistant were ded-
icated to this effort as the number of charts skyrocketed (see Fig. 14-1) with the success
of the effort (see Fig. 14-2).
The leadership shown by the plant manager went well beyond the training. He
made sure that:
• The metric of FTY was clearly posted at the front of all production lines.
• FTY was discussed at each morning meeting.
• FTY was a key topic in the weekly production planning meeting.
• Once a month, chaired by the plant manager, there was a meeting to address
FTY and FTY alone. This meeting was attended by all plant management, and
the minutes were distributed to everyone in a supervisory position.
There was no question that FTY was important, and there was no question that the
plant manager was leading this effort. This effort could be heard, seen, and felt in all
Total No. of Control Charts - Alpha Line
350
300
250
200
150
100
50
0
Mar-01 May-01 Jul-01 Sep-01 Nov-01 Jan-02 Mar-02 May-02 Jul-02 Sep-02 Nov-02 Jan-03 Mar-03 May-03 Jul-03 Sep-03
FIGURE 14-1 Total number of control charts: Alpha line.