
Page 237 - How To Implement Lean Manufacturing
P. 237
The Story of the Alpha Line 215
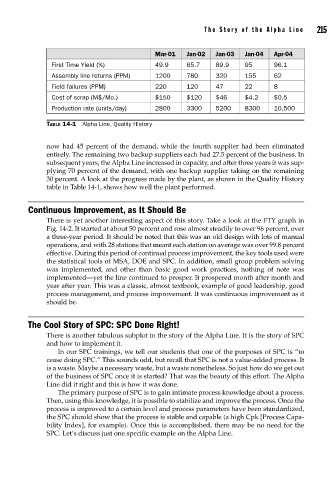
Mar-01 Jan-02 Jan-03 Jan-04 Apr-04
First Time Yield (%) 49.9 65.7 89.9 95 96.1
Assembly line returns (PPM) 1200 780 320 155 62
Field failures (PPM) 220 120 47 22 8
Cost of scrap (M$/Mo.) $150 $120 $46 $4.2 $0.5
Production rate (units/day) 2800 3300 5200 8300 10,500
TABLE 14-1 Alpha Line, Quality History
now had 45 percent of the demand, while the fourth supplier had been eliminated
entirely. The remaining two backup suppliers each had 27.5 percent of the business. In
subsequent years, the Alpha Line increased in capacity, and after three years it was sup-
plying 70 percent of the demand, with one backup supplier taking on the remaining
30 percent. A look at the progress made by the plant, as shown in the Quality History
table in Table 14-1, shows how well the plant performed.
Continuous Improvement, as It Should Be
There is yet another interesting aspect of this story. Take a look at the FTY graph in
Fig. 14-2. It started at about 50 percent and rose almost steadily to over 96 percent, over
a three-year period. It should be noted that this was an old design with lots of manual
operations, and with 28 stations that meant each station on average was over 99.8 percent
effective. During this period of continual process improvement, the key tools used were
the statistical tools of MSA, DOE and SPC. In addition, small group problem solving
was implemented, and other than basic good work practices, nothing of note was
implemented—yet the line continued to prosper. It prospered month after month and
year after year. This was a classic, almost textbook, example of good leadership, good
process management, and process improvement. It was continuous improvement as it
should be.
The Cool Story of SPC: SPC Done Right!
There is another fabulous subplot in the story of the Alpha Line. It is the story of SPC
and how to implement it.
In our SPC trainings, we tell our students that one of the purposes of SPC is “to
cease doing SPC.” This sounds odd, but recall that SPC is not a value-added process. It
is a waste. Maybe a necessary waste, but a waste nonetheless. So just how do we get out
of the business of SPC once it is started? That was the beauty of this effort. The Alpha
Line did it right and this is how it was done.
The primary purpose of SPC is to gain intimate process knowledge about a process.
Then, using this knowledge, it is possible to stabilize and improve the process. Once the
process is improved to a certain level and process parameters have been standardized,
the SPC should show that the process is stable and capable (a high Cpk [Process Capa-
bility Index], for example). Once this is accomplished, there may be no need for the
SPC. Let’s discuss just one specific example on the Alpha Line.