Page 85 - How To Implement Lean Manufacturing
P. 85

66    Cha pte r  F o u r


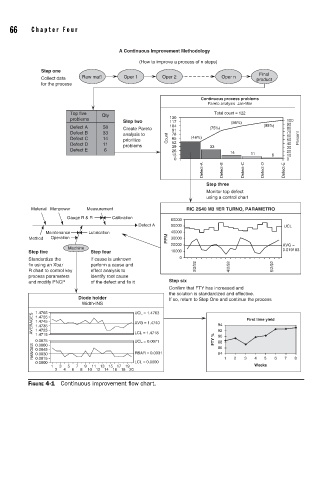
                                         A Continuous Improvement Methodology
                                              (How to improve a process of n steps)
                   Step one                                                     Final
                   Collect data  Raw mat’l  Oper 1   Oper 2           Oper n   product
                   for the process

                                                                Continuous process problems
                                                                  Pareto analysis  Jan-Mar
                           Top five  Qty                           Total count = 122
                           problems                    130
                                          Step two     117              (86%)           100
                           Defect A  58   Create Pareto  104      (75%)          (95%)  90
                                                                                        80
                           Defect B  33   analysis to  91                               70
                                                       78
                           Defect C  14   prioritize  Count  65  (48%)                  60  Percent
                                                                                        50
                           Defect D  11   problems     52         33                    40
                                                       39
                           Defect E  6                 26               14              30
                                                                                        20
                                                       13                     11    6   10
                                                        0                               0
                                                                Defect-A  Defect-B  Defect-C  Defect-D  Defect-E
                                                                 Step three
                                                                 Monitor top defect
                                                                 using a control chart
                Material Manpower  Measurement              RIC 2S40 M3 1ER TURNO, PARAMETRO
                          Gauge R & R  Calibration
                                                       60000
                                              Defect A  50000                          UCL
                    Maintenance  Lubrication           40000
               Method  Operation                      PPM  30000
                                                       20000                           AVG =
                          Machine                                                      0.019103
               Step five         Step four             10000
               Standardize the   If cause is unknown      0
               fix using an Xbar  perform a cause and         3/2/92    4/2/92      5/2/92
               R chart to control key  effect analysis to
               process parameters  identify root cause
               and modify PNCP   of the defect and fix it  Step six
                                                       Confirm that FTY has increased and
                                                       the solution is standardized and effective.
                             Diode holder
                                                       If so, return to Step One and continue the process
                              Width-INS      UCL = 1.4763
                AVERAGES 1.4765              AVG = 1.4740           94       First time yield
                 1.4755
                 1.4745
                 1.4735
                                                                    92
                 1.4725
                                             LCL = 1.4718
                 1.4715
                                                                    90
                RANGES 0.0075                UCL = 0.0071          FTY %  88
                 0.0060
                                                                    86
                 0.0045
                                                                    84
                                             RBAR = 0.0031
                 0.0030
                 0.0015
                 0.0000                      LCL = 0.0000             1  2  3  4  5  6  7  8
                     1  3  5  7  9  11 13 15 17 19                             Weeks
                       2  4  6  8  10 12 14 16 18 20
               FIGURE 4-1  Continuous improvement fl ow chart.
   80   81   82   83   84   85   86   87   88   89   90