
Page 124 - Human Inspired Dexterity in Robotic Manipulation
P. 124
122 Human Inspired Dexterity in Robotic Manipulation
0.8
Pressure [MPa] 0.6
0.7
0.5
0.4
0.3
0.2
0.1
0 15 20
0 5
10 10
15 20 5 Y [mm]
(A) X [mm] 25 0
0.8
Pressure [MPa] 0.6
0.7
0.5
0.4
0.3
0.2
0.1 25
0 15 20
0 5
10 10
15 20 5 Y [mm]
(B) X [mm] 25 0
0.8
Pressure [MPa] 0.6
0.7
0.5
0.4
0.3
0.2
0.1 16 18
0 12 14
0 2 4 6 6 8 10
8 10
12 14 16 2 4 Y [mm]
(C) X [mm] 18 0
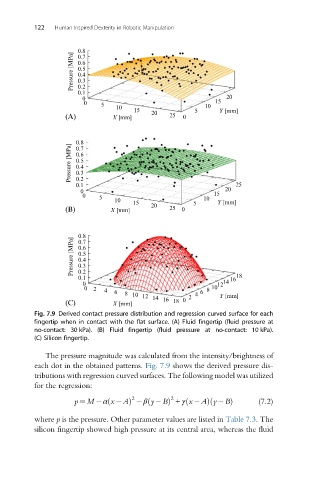
Fig. 7.9 Derived contact pressure distribution and regression curved surface for each
fingertip when in contact with the flat surface. (A) Fluid fingertip (fluid pressure at
no-contact: 30 kPa). (B) Fluid fingertip (fluid pressure at no-contact: 10 kPa).
(C) Silicon fingertip.
The pressure magnitude was calculated from the intensity/brightness of
each dot in the obtained patterns. Fig. 7.9 shows the derived pressure dis-
tributions with regression curved surfaces. The following model was utilized
for the regression:
2 2
p ¼ M α x AÞ β y Bð Þ + γ x AÞ y BÞ (7.2)
ð
ð
ð
where p is the pressure. Other parameter values are listed in Table 7.3. The
silicon fingertip showed high pressure at its central area, whereas the fluid